Introduction to Normal Distribution and Z-Table
Dive into the realm of Normal Distribution, exploring concepts like the Standard Normal Distribution, Cumulative z-curve area, and using the Z-table for calculations. Understand the procedure for solving Normal Distribution problems and interpreting percentiles and symmetrically located areas.

Download Presentation

Please find below an Image/Link to download the presentation.
The content on the website is provided AS IS for your information and personal use only. It may not be sold, licensed, or shared on other websites without obtaining consent from the author.If you encounter any issues during the download, it is possible that the publisher has removed the file from their server.
You are allowed to download the files provided on this website for personal or commercial use, subject to the condition that they are used lawfully. All files are the property of their respective owners.
The content on the website is provided AS IS for your information and personal use only. It may not be sold, licensed, or shared on other websites without obtaining consent from the author.
E N D
Presentation Transcript
6.2 Normal Distribution http://delfe.tumblr.com/ 1
6.2/6.5: The Normal Distribution The Normal Approximation to the Binomial Distribution - Goals Be able to sketch the normal distribution. Be able to standardize a value. Be able to use the Z-table. Be able to calculate probabilities. Be able to calculate percentiles (Inverse calculations). Determine when you can use the normal approximation to the binomial and perform calculations using this approximation. 2
Normal Distribution ? 2?? (? ?)2 1 2?2 ? ? = where - < < , > 0 X ~ N( , 2) 3
Shapes of Normal Density Curve http://resources.esri.com/help/9.3/arcgisdesktop/com/gp_toolref /process_simulations_sensitivity_analysis_and_error_analysis_modeling /distributions_for_assigning_random_values.htm 4
Standard Normal Distribution (z curve) ? 2?? (? ?)2 1 2?? ?2 1 2?2 ? ? = ? ? = 2 where - < < , > 0 = 0, 2 = 1 6
Z-table 8
Using the Z table area right of z = 1 area left of z area between z1 and z2 = area left of z1 area left of z2 9
Procedure for Normal Distribution Problems 1. Sketch the situation and shade the area to be found. Optional but extremely useful. 2. Standardize X to state the problem in terms of Z. 3. Use Table III to find the area to the left of z. 4. Calculate the final answer. 5. Write your conclusion in the context of the problem. ? =? ? ? 10
Percentiles ? =? ? ? 11
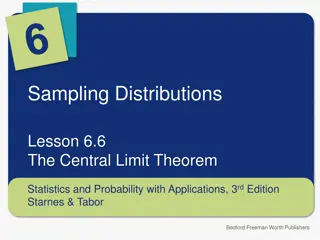
Why Approximate the Binomial Distribution? 1. Intervals 2. Computation (n large) 3. Inference 13
Difficulties with the Normal Approximation to the Binomial 1. Skewedness of the Binomial Distribution. 2. The Binomial Distribution is discrete. 14
Continuity Correction file:shifted-binomial-to-4.png http://wiki.axlesoft.com/index.php?title=Continuity_correction 15
Continuity Correction Actual Value Approximate Value P(X = a) P(a 0.5 < X < a +0.5) P(a < X) P(a + 0.5 < X) P(a X) P(a 0.5 < X) P(X < b) P(X < b 0.5) P(X b) P(X < b + 0.5) 16


")