Explore the basics of statistical analysis, including descriptive and inferential statistics, population vs. sample, variables, data types, and key terms like parameter and statistic. Learn through exercises on school supplies spending and malpractice insurance studies.
Please find below an Image/Link to download the presentation.
The content on the website is provided AS IS for your information and personal use only. It may not be sold, licensed, or shared on other websites without obtaining consent from the author. If you encounter any issues during the download, it is possible that the publisher has removed the file from their server.
You are allowed to download the files provided on this website for personal or commercial use, subject to the condition that they are used lawfully. All files are the property of their respective owners.
The content on the website is provided AS IS for your information and personal use only. It may not be sold, licensed, or shared on other websites without obtaining consent from the author.
E N D
Presentation Transcript
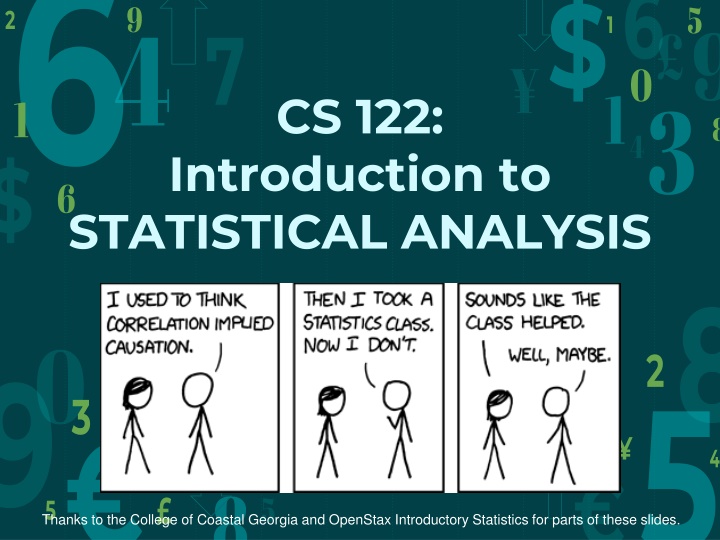
6 $ 9 5 2 1 9 4 7 0 CS 122: 1 1 3 8 4 Introduction to STATISTICAL ANALYSIS $ 6 8 0 2 9 3 5 2 7 4 8 5 5 Thanks to the College of Coastal Georgia and OpenStax Introductory Statistics for parts of these slides.
$ 6 1 5 9 0 Today's agenda: 1 Introductions 3 8 4 Class policies and procedures 2 Types of data 5 Sampling techniques 7 4 Descriptive statistics 8
$ 6 1 5 Types of statistics this quarter: 9 0 1 DESCRIPTIVE STATISTICS Organizing and summarizing data. Two ways to summarize data are by graphing and by using numbers (for example, finding an average). 3 8 4 2 INFERENCIAL STATISTICS Predicting future behavior based on past. 5 Statistical inference A determination of how confident we can be that our predictions are correct. 7 4 8
$ 6 Pieces of the calculation 1 5 population: a collection of persons, things, or objects under study. sample: a portion (or subset) of the larger population to study to gain information about the population. Data are the result of sampling from a population. statistic: a number calculated from the sample data that represents a property of the sample. parameter: a number that is a property of the population. The statistic is an estimate of this. The accuracy of this estimate depends on how well the sample represents the population: The sample must contain the characteristics of the population in order to be a representative sample. variable: gender, ethnicity, etc. Data: single value. 9 0 1 3 8 4 2 5 a characteristic of interest for each person or thing in a population. generally written as capital letters such as X and Y Numerical variables: take on values with equal units such as weight in pounds and time in hours. Categorical variables: place the person or thing into a category. Examples: Political affiliation, eye color, 7 4 8 the actual values of the variable. They may be numbers or they may be words. Datum is a
$ 6 Exercise 1: school supplies 1 5 9 0 Determine what the key terms refer to in the following study: 1 3 8 We what to know the average (mean) amount of money first year college students spend at ABC College on school supplies (not including books). 4 2 We randomly survey 100 first year students at the college. Three of those students spent $150, $200 and $225, respectively 5 Population Sample Parameter Statistic Variable Data 7 4 8
$ 6 Exercise 2: malpractice insurance 1 5 Determine what the key terms refer to in the following study: 9 0 1 An insurance company would like to determine the proportion of all medical doctors who have been involved in one or more malpractice lawsuits. 3 8 4 The company selects 500 doctors at random from a professional directory and determines the number in the sample who have been involved in a malpractice suit. 2 5 Population Sample Parameter Statistic Variable Data 7 4 8
$ 6 Types of data: 1 5 9 0 Qualitative data the result of categorizing or describing attributes of a population. Examples: Hair color, blood type, ethnic group, the car a person drives, etc. 1 3 8 4 Quantitative data always numbers. The result of counting or measuring attributes of a population. Examples: Amount of money, pulse rate, weight, number of people living in your town, and number of students who take statistics, etc. quantitative discrete data: All data that are the result of counting. These data take on only certain numerical values. No student can be in a class. quantitative continuous data: All data that are the result of measuring (assuming that we can measure accurately). 2 5 7 4 8
$ 6 Exercise 3: categorizing data 1 5 Work together to determine whether each of the following types of data is qualitative, quantitative discrete or quantitative continuous. 9 0 1 3 8 4 2 5 7 4 8
$ 6 1 5 9 0 1 3 What could cause our analysis to be incorrect and/or biased? 8 4 2 5 7 4 8
$ 6 Our first descriptive statistics 1 5 9 0 1 Mean: the average of our data add up all the data and divide by the number of datapoints added Median: The middle number in a sorted list of the data Mode: the value that appears most frequently in a data set 3 8 4 2 5 7 4 8