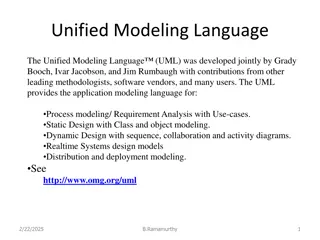
Introduction to UML Timing Diagrams

UML timing diagrams visually represent the change in state or value of elements over time. They show interactions between timed events, time constraints, and duration constraints governing them. Elements include state lifelines and value lifelines, each displaying changes over time. Learn how state and value lifelines can be stacked, events defined, and messages passed between lifelines to create comprehensive timing diagrams.

Download Presentation

Please find below an Image/Link to download the presentation.
The content on the website is provided AS IS for your information and personal use only. It may not be sold, licensed, or shared on other websites without obtaining consent from the author.If you encounter any issues during the download, it is possible that the publisher has removed the file from their server.
You are allowed to download the files provided on this website for personal or commercial use, subject to the condition that they are used lawfully. All files are the property of their respective owners.
The content on the website is provided AS IS for your information and personal use only. It may not be sold, licensed, or shared on other websites without obtaining consent from the author.
E N D
Presentation Transcript
DAVU DAV UNIVERSITY DEPARTMENT OF COMPUTER SCIENCE AND ENGINEERING COURSE NAME :OOAD COURSE CODE: CSE429
TIMING DIAGRAM
INTRODUCTION UML timing diagrams are used to display the change in state or value of one or more elements over time. State 1 State 2 timeline t1 t2 It can also show the interaction between timed events the time and duration constraints that govern them.
ELEMENTS OF TIMING DIAGRAM State Lifeline Value Lifeline
State Lifeline A state lifeline shows the change of state of an item over time. The X-axis displays elapsed time in whatever units are chosen, while the Y-axis is labelled with a given list of states. A state lifeline is shown below.
Value Lifeline A value lifeline shows the change of value of an item over time. The X- axis displays elapsed time in whatever units are chosen, the same as for the state lifeline. The value is shown between the pair of horizontal lines which cross over at each change in value. A value lifeline is shown below.
State and value Lifelines Together State and value Lifelines can be stacked one on top of another in any combination. They must have the same X-axis. Messages can be passed from one lifeline to another. Each state or value transition can have a defined event, a time constraint which indicates when an event must occur, and a duration constraint which indicates how long a state or value must be in effect for. Once these have all been applied, a timing diagram may look like the following.