Inventory Management Strategies Analysis
Explore various inventory management strategies such as Re-Order Point, Centralization, and Postponement in supply chain scenarios, discussing safety stock calculations, lead times, and centralized vs decentralized systems.
Download Presentation

Please find below an Image/Link to download the presentation.
The content on the website is provided AS IS for your information and personal use only. It may not be sold, licensed, or shared on other websites without obtaining consent from the author. If you encounter any issues during the download, it is possible that the publisher has removed the file from their server.
You are allowed to download the files provided on this website for personal or commercial use, subject to the condition that they are used lawfully. All files are the property of their respective owners.
The content on the website is provided AS IS for your information and personal use only. It may not be sold, licensed, or shared on other websites without obtaining consent from the author.
E N D
Presentation Transcript
Re-Order-Point and Centralization Re-Order-Point and Centralization
Centralization and ROP There are N warehouses. Each with lead time demand of LTD and with standard deviation of lead time demand of LTD. If demand in each warehouse is independent of demand in other warehouses. If they order all together and have a centralized safety stock then The average demand during lead time for all the warehouses is N(LTD). The standard deviation of the lead time demand for all warehouses is NOT N LTD, it is ?( LTD) Re-Order-Point, Centralization, and Postponement. 2
Centralization and ROP Warehouse A Warehouse B SL = 95% Isafety each = 1.65(10) Isafety each = 16.5 Isafety all = 33 Demand N(80,10) Demand N(80,10) Warehouse A Warehouse B SL = 95% Isafety all = 1.65(14.14) Isafety all = 23.3 Demand N(160, ???)=N(160,14.14) Re-Order-Point, Centralization, and Postponement. 3
Independent Lead time Demands at N Locations GE lighting with 7 warehouses. LTD for each warehouse has mean of 20,000 units and StdDev of 5,000 units and. Compute total Isafety at SL= 95% service level for centralized and decentralized systems. Isafety = 1.65 5000= 8250 Decentralized= 7 8250 = 57,750 Isafety Centralized is not 7(5000) LTD Centralized is 7(5000)2 ( )LTD Centralized = 7 5000 ( 2)LTD Centralized= N( LTD) = LTD 7 5000 = 2.6457 5000 Centralized=13228 ILTD Centralized=(1.65) 13228 LTD Centralized= 21826 Isafety Decentralized Centralized=57750 Isafety Isafety 21826= 2.65 7 Re-Order-Point, Centralization, and Postponement. 4
Centralization & Postponement Epson produces printers for sale in Europe in its Taiwan factory. Printers sold in different countries differ in terms of the power outlet as well as the language manuals. Currently Epson assembles and packs printers for sale in individual countries. Weekly demand in different countries is normally distributed with mean and standard deviation as shown in table: Assume demand in different countries to be independent. Given that the lead time from the Taiwan factory is six weeks, how much safety inventory does Epson require in Europe if it targets 96% probability of no stock out (CSL)? R = Read From Table, for example for France it is 30,000. L=6 for all. LTDFrance = 6(30000)=180,000 LTDFrance = SQRT(6)7500 = 2.44949(7500)=18371 Z96% = 1.7507 Is= Z96%( LTDFrance)= 1.7507(18371) = 32182 Mean weekly demand Standard deviation of weekly demand Country France Germany Spain Italy Portugal UK 30,000 23,000 14,000 34,000 21,000 45,000 7,500 5,200 2,200 6,800 4,300 9,100 Re-Order-Point, Centralization, and Postponement. 5
Centralization Epson decides to build a central DC in Europe. It will ship base printers (without power supply) to the DC. When an order is received, the DC will assemble power supplies, add manuals, and ship the printers to the appropriate country. The printers are still to be manufactured in Taiwan with the same lead-time. How much safety inventory can Epson expect to save as a result if it still targets 96% CSL? Mean weekly demand Standard deviation of weekly demand LTD ( LTD)2 Country L LTD Z96% Is ROP France Germany Spain Italy Portugal UK Total - Decentralized 30,000 23,000 14,000 34,000 21,000 45,000 7500 5200 2200 6800 4300 9100 6 180000 18371 1.7507 32162 212162 337500000 6 138000 12737 1.7507 22299 160299 162240000 6 84000 5389 1.7507 9434 93434 29040000 6 204000 16657 1.7507 29161 233161 277440000 6 126000 10533 1.7507 18440 144440 110940000 6 270000 22290 1.7507 39024 309024 496860000 1002000 Isafety Decentralized 150520 1414020000 Variance of all 37603 StdDev of All 65832 z96%*StdDev 0.437 Isafety Centralized Centralized Re-Order-Point, Centralization, and Postponement. 6
Independent Lead Time Demands at N Locations In Inventory; Centralization leads to reduction in EOQ, and therefore Icycle Isafety Average inventory Flow time In Waiting Line; Centralization , or Polling, leads to (i) flow time reduction and (ii) throughput improvement. If centralization reduces inventory, why doesn t everybody do it? Less understanding of customer needs Less understanding of cultural, linguistics, and regulatory barriers Longer response time Higher shipping cost which may lead to higher prices These disadvantages may reduce the demand. Re-Order-Point, Centralization, and Postponement. 7
Principle of Aggregation and polling Inventory Inventory benefits due to principle of aggregation. Statistics: standard deviation of sum of random variables is less than the sum of the individual standard deviations. Physical consolidation is not essential, as long as available inventory is shared among various locations Polling Inventory Virtual Centralization Specialization one warehouse carries the majority of Isafety for all warehouses Component Commonality a single motor in several models of a car factory Delayed Differentiation a shirt in 4 model and 9 colors Product Substitution a better available product for a less expensive stocked out Re-Order-Point, Centralization, and Postponement. 8
Lessons Learned Levers for Reducing Safety Inventory Reduce demand variability through improved forecasting Reduce replenishment lead time Reduce variability in replenishment lead time poll safety inventory for multiple locations or products Postpone product-differentiation processing until closer to the point of actual demand Use common components Exploit product substitution Re-Order-Point, Centralization, and Postponement. 9
Virtual Centralization Virtual Centralization: inventory polling is facilitated using information regarding availability of goods and subsequent transshipment between locations. Location A Location B Exceeds Available stock Less than Available stock 1. Information about product demand and availability must be available at both locations 2. Shipping the product from one location to a customer at another location must be fast and cost effective Polling is achieved by keeping the inventories at decentralized locations. Re-Order-Point, Centralization, and Postponement. 10
Component Commonality We discussed aggregating demand across various geographic locations, either physical or virtual Aggregating demand across various products has the same benefits. Computer manufacturers: offer a wide range of models, but few components are used across all product lines. Replace Make-to-stock with make Make-to-Order Commonality + MTO: Commonality: Safety inventory of the common components much less than safety inventory of unique components stored separately. MTO: Inventory cost is computed in terms of WIP cost not in terms of finished good cost (which is higher). Re-Order-Point, Centralization, and Postponement. 11
Postponement (Delayed Differentiation) Forecasting Characteristic: Forecasts further into the future tends to be less accurate than those of more imminent events. Since shorter-range forecasts are more accurate, operational decisions will be more effective if supply is postponed closer to the point of actual demand. Two Alternative processes (each activity takes one week) Alternative A: (1) Coloring the fabric, (2) assembling T-shirts Alternative B: (1) Assembling T-shirts, (2) coloring the fabric No changes in flow time. Alternative B postponed the color difference until one week closer to the time of sale. Takes advantage of the forecasting characteristic: short-Range forecast more accurate. Re-Order-Point, Centralization, and Postponement. 12
Postponement (Delayed Differentiation) Two advantages: Taking advantage of two demand forecasting characteristics Commonality Advantage: At week 0; Instead of forecast for each individual item, we forecast for aggregates item uncolored T-shirt. Forecast for aggregate demand is more accurate than forecast for individual item. It is easier to more accurately forecast total demand for different colored T-shirts for next week than the week after the next. Postponement Advantage: Instead of forecasting for each individual items two weeks ahead, we do it at week 1. Shorter rang forecasts are more accurate. It is easier to more accurately forecast demand for different colored T-shirts for next week than the week after the next. Re-Order-Point, Centralization, and Postponement. 13
Example of process postponement - Benetton A world leader in knitwear Massive volume, many stores Many small stores with limited storage March: Final designs for a collection March-July: Store owners place orders July: Production starts based on first 10% of orders August-December: Store adjust orders (colors) January: Primary collection hit stores Re-Order-Point, Centralization, and Postponement. 14
Benetton - Old and New Manufacturing Process Spin or Purchase Yarn Spin or Purchase Yarn Manufacture Garment Parts Dye Yarn Join Parts Finish Yarn This step is postponed Dye Garment Manufacture Garment Parts Finish Garment Join Parts Re-Order-Point, Centralization, and Postponement. 15
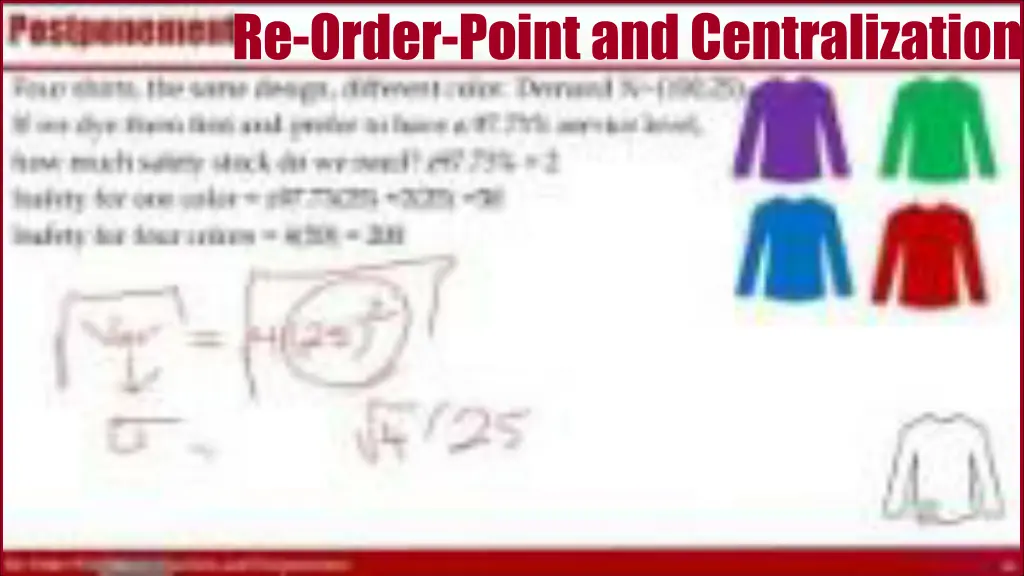
Postponement Four shirts, the same design, different color. Demand N~(100,25). If we dye them first and prefer to have a 97.73% service level, how much safety stock do we need? z97.73% = 2 Isafety for one color = z97.73(25) =2(25) =50 Isafety for four colors = 4(50) = 200 What if we have a high-speed dyeing machine and could postpone dyeing the uncolored fabric to when the demand comes with the same service level? Standard Deviation of Demand for 4 colors = SQRT(4)(25) =50 Isafety for 4 colors = z97.73(50) =2(50) =100 100/200; that is 50% improvement in safety stock cost Re-Order-Point, Centralization, and Postponement. 16
Value of Postponement 100 different paint colors, R = 30/week, R = 10, CSL = 0.95 Isafety_OneProduct = z0.95(10) = 1.65(10)= 16.5 Isafety_100Products Without Postponement = 100(16.5)= 1650 Standard deviation of demand of 100 products = SQRT(100)*10 =100 Isafety_100Products With Postponement = z0.95(100) = 1.65(100) = 165 1650 is reduced to 165. That is 10 times or SQRT(100) Re-Order-Point, Centralization, and Postponement. 17
Postponement Mean StdDev Colors Models Mean 4 Models StdDev 4 Models SL ROP for 4 Models Is for 4 models Is for 4 9 SKU 100 25 9 4 400 50 Mean 9 colors StdDev 9 Color SL ROP for 9 Colors Is for 9 Colors Is for 4 9 SKU % reduction in SS 900 75 0.97725 0.97725 1050 500 100 900 150 600 0.33333 The larger the ratio of the larger to smaller number, the higher the saving in safety Inventory Suppose we have 100% right information about the market in the second phase and fulfill the orders to precision as long as we are not out of stock Re-Order-Point, Centralization, and Postponement. 18


