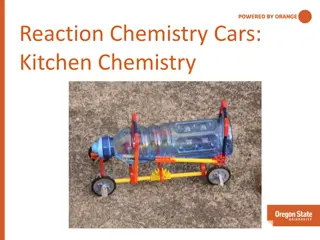
Explore the process of creating cold packs by conducting a preliminary experiment with different chemicals. Discover the best chemical through data analysis and experimentation to make an effective cold pack.
Please find below an Image/Link to download the presentation.
The content on the website is provided AS IS for your information and personal use only. It may not be sold, licensed, or shared on other websites without obtaining consent from the author. If you encounter any issues during the download, it is possible that the publisher has removed the file from their server.
You are allowed to download the files provided on this website for personal or commercial use, subject to the condition that they are used lawfully. All files are the property of their respective owners.
The content on the website is provided AS IS for your information and personal use only. It may not be sold, licensed, or shared on other websites without obtaining consent from the author.
E N D
Presentation Transcript
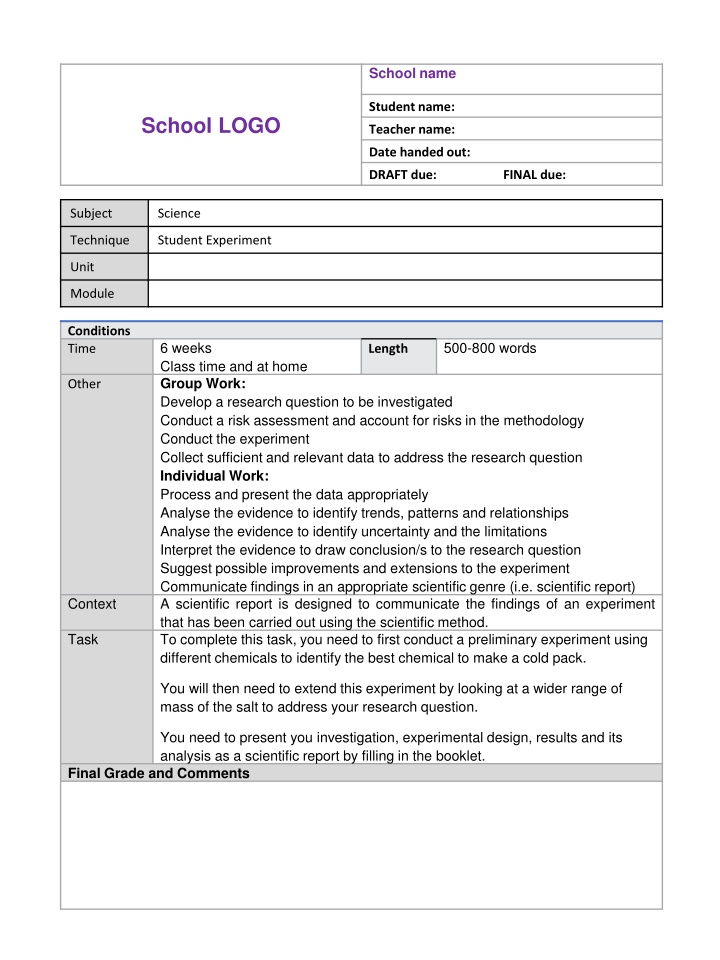
School name Student name: School LOGO Teacher name: Date handed out: DRAFT due: FINAL due: Subject Science Technique Student Experiment Unit Module Conditions Time 6 weeks Class time and at home Group Work: Develop a research question to be investigated Conduct a risk assessment and account for risks in the methodology Conduct the experiment Collect sufficient and relevant data to address the research question Individual Work: Process and present the data appropriately Analyse the evidence to identify trends, patterns and relationships Analyse the evidence to identify uncertainty and the limitations Interpret the evidence to draw conclusion/s to the research question Suggest possible improvements and extensions to the experiment Communicate findings in an appropriate scientific genre (i.e. scientific report) A scientific report is designed to communicate the findings of an experiment that has been carried out using the scientific method. To complete this task, you need to first conduct a preliminary experiment using different chemicals to identify the best chemical to make a cold pack. 500-800 words Length Other Context Task You will then need to extend this experiment by looking at a wider range of mass of the salt to address your research question. You need to present you investigation, experimental design, results and its analysis as a scientific report by filling in the booklet. Final Grade and Comments
General Tips Keep your writing impersonal; you may not use first person (i.e. I or we) Use the metric system of measurement and abbreviate measurements without periods (i.e. cm kg) spell out all numbers beginning sentences or less than 10 (i.e. "two explanations of six factors"). Write numbers as numerals when greater than ten (i.e. 156) or associated with measurements (i.e. 6 mm or 2 g) Make sure you use key terms through-out your report. Have a neutral person review and critique your report before submission. Achievement Standard By the end of Year 9, students explain chemical processes and natural radioactivity in terms of atoms and energy transfers and describe examples of important chemical reactions. They describe models of energy transfer and apply these to explain phenomena. They explain global features and events in terms of geological processes and timescales. They analyse how biological systems function and respond to external changes with reference to interdependencies, energy transfers and flows of matter. They describe social and technological factors that have influenced scientific developments and predict how future applications of science and technology may affect people s lives. Students design questions that can be investigated using a range of inquiry skills. They design methods that include the control and accurate measurement of variables and systematic collection of data and describe how they considered ethics and safety. They analyse trends in data, identify relationships between variables and reveal inconsistencies in results. They analyse their methods and the quality of their data, and explain specific actions to improve the quality of their evidence. They evaluate others methods and explanations from a scientific perspective and use appropriate language and representations when communicating their findings and ideas to specific audiences. Parent Response: I have read the feedback on this assessment task. ______________________________________ ____________________________ Your Signature Date
PART A: Preliminary Experiment Introduction: Have you ever used a hot pack to warm your hands or a cold pack on an injury? How can something produce heat or cold without any microwaving or refrigeration involved? The answer is: chemistry. Chemical reactions that produce heat are called exothermic. The burning of fuel in a car engine is an example of an exothermic reaction. Chemical reactions that absorb heat are called endothermic. As an example of an endothermic reaction, when the chemical potassium chloride is dissolved in water, the resulting solution is colder than either of the starting materials. This kind of endothermic process is used in instant cold packs. These cold packs have a strong outer plastic layer that holds a bag of water and a chemical, or mixture of chemicals, that result in an endothermic reaction when dissolved in water. When the cold pack is squeezed, the inner bag of water breaks and the water mixes with the chemicals. The cold pack starts to cool as soon as the inner bag is broken and stays cold for over an hour. There are many different chemicals used for instant cold packs, not just potassium chloride. 'the aim of this experiment is to ' The aim of this experiment is to determine the most suitable salt chemical to make a COLD pack when added to a controlled amount of water (10mL). The salt chemicals to choose from will be Potassium Chloride, Sodium Carbonate (washing soda) and Sodium Bicarbonate (baking soda). Dependent Variable Variable Independent Specific Specific Research Question: Which type of salt has the greatest DROP in temperature when 2 grams is mixed with 10mL of water potassium chloride, sodium carbonate or sodium bicarbonate? Specific Hypothesis: If .then ..because . If 2 grams of potassium chloride, sodium carbonate and sodium bicarbonate are each added to 10mL of water, then potassium chloride will have the greatest drop in temperature because whilst the chemical properties of potassium and sodium are similar (both in group 1 on the periodic table) potassium is considerably more reactive (Tikkanen, 2022). Don t forget to reference your justification using an in-text citation!
Method: 1. Add 10mL of water to a 50mL beaker. 2. Measure and record the initial temperature of the water. 3. Tare patty paper on a balance (0.00g). 4. Weight 2 grams of potassium chloride (on the patty paper). 5. Add the 2 grams of potassium chloride to the 10mL water and start the stopwatch. 6. Stir with the thermometer. 7. Wait until the temperature becomes stable. 8. Record the final temperature to one decimal place. 9. Calculate the temperature change by subtracting the final temperature from the initial temperature 10. Repeat a second time. Calculate mean (average) and absolute uncertainty (range / 2). 11. Repeat steps 1-10 for the other two chemical salts Sodium carbonate and Sodium bicarbonate. Make sure there is enough detail for the experiment to be repeated by someone else based on your methods! Materials: 50mL Beaker 10mL Water Measuring Cylinder Disposable Pipette Thermometer Cup Cake Patty Paper Balance/Scale 2 grams KCl 2 grams Na2CO3 2 grams NaHCO3 Spatula 2 grams of Potassium chloride was added to 10mL of water and stirred. The initial temperature was subtracted from the final temperature. This was repeated a second time. Average and absolute uncertainty was calculated. The above steps were repeated for sodium carbonate and sodium bicarbonate. Safety was managed by wearing safety glasses, gloves and a lab coat. Draw a labelled diagram of the experimental design Figure 1: the experimental design Remember the caption!
Complete the Results Table below Results: D for DATA D for dependent variable Remember the caption! Table 1: Results Temp. change (Initial Final Temperature) Mean temp. change Initial Final Range 2 Temperature Temperature Chemical Added Trial 1 Trial 2 Trial 1 Trial 2 Trial 1 Trial 2 Trial 1&2 Trial 1&2 Potassium chloride KCl Sodium carbonate Na2CO3 Sodium bicarbonate NaHCO3 Quantitative Data uses numbers Qualitative Data uses words DESCRIBE your observations below My observations were Figure 2: Observations Remember the caption!
Complete the (second) Results Table below Table 2: Exothermic or Endothermic? Chemical Added Exothermic or Endothermic? Potassium chloride KCl Sodium carbonate Na2CO3 Sodium bicarbonate NaHCO3 Exothermic = the temperature increases Endothermic = the temperature decreases Re-state your Results (as text) Always start your results section by answering the research question! 1. Copy/paste the words from the research question 2. Edit the words to change the format from a question to an answer The type of salt that had the greatest DROP in temperature when 2 grams was mixed with 10mL of water was .(indicate correct answer) [potassium chloride] [sodium carbonate] [sodium bicarbonate] NEXT, state if the hypothesis was supported or not supported by your results The hypothesis was..... (indicate correct answer) [supported] [not supported]
Make sure your choice of graph can answer your research question! Complete the Column Chart below Mean temperature change when 2g salt is added to 10mL water Chart Title Don t forget the units of measurement! 6.0 Mean Temperature Change (deg C) 5.5 5.0 4.5 4.0 3.5 3.0 2.5 2.0 1.5 1.0 0.5 y-axis = dependent variable 0 Potassium chloride Sodium carbonate Sodium bicarbonate x-axis = independent variable Salt Figure 3: The mean temperature change (deg C) when 2g of potassium chloride (KCl), 2g of sodium bicarbonate (Na2CO3) and 2g of sodium bicarbonate (NaHCO3) is added to 10mL of water each.
For the last part of your RESULTS section, IDENTIFY any trends, patterns, relationships as well as any anomalies and margins of error. What is a TREND? Trendsare changes that move in a particular direction. Look for these things: An overall change in the data across the graph (i.e. the change may be an increase or a decrease. Other times, the lack of change may be a trend worth noting). For example, is the line on a line graph (or scatterplot) going in one particular direction? Identifying a trend makes it easier to then make predictions. What is a PATTERN? Patterns are changes that occur more than once. Look for a repeating PATTERN. For example, the amount of something may increase or decrease regularly (e.g. the temperature where you live usually goes up during the day and down during the night). What is a RELATIONSHIP? A relationship refers to the correspondence between two variables. Whereby, one of the variables is on the x-axis and the other variable is on the y-axis. If one variable increases, does the other variable increase or decrease? What is an ANOMALY? An anomaly is an observationthat differs from what you were expecting. The odd one out. Something that does not fit the general trend. Perhaps a mistake? For example, all measurements are the same except for one. That one is the anomaly. Sometimes, it s better to delete the anomaly from your dataset (particularly if you think it is wrong).
What is a Margin of ERROR? The Margin of ERRORquantifies the range of uncertainty in your result (chance of an error). Very few experiments produce perfect results. Every experiment should have at least 3 repeats or trials (you may have noticed, this preliminary experiment only had two trials). It is important to have at least 3 repeats because it helps to identify any anomalies in your dataset. For example, if you only measure something once, with no repeats, how can you be sure it is correct? If you measure it twice, and they are both different, how do you know which one is correct and which one is incorrect? If you measure something three times, you can easily see if a value might be wrong (the anomaly) because you have two others to compare it to. Why have at least 3 repeats? Answer in the box below. What has this got to do with margin of error you ask? Remember, the margin of error quantifies (tells you using numbers) the range of uncertainty in your result. For example, each repeat is testing the exact same thing. Each repeat is set up to be exactly the same. Theoretically, each repeat should therefore produce the exact same result. If they do, the margin of error is zero. If each repeat is not exactly the same, your margin of error tells you by how much. There are several ways to quantify the margin of error. Examples include: the range, absolute uncertainty and standard deviation. In this experiment we use absolute uncertainty . To calculate absolute uncertainty, simple divide the range by 2. What is the range? Remember from maths .the range is the difference between the highest and the lowest value in a dataset (in this case, the dataset includes all repeats testing the same thing). Absolute Uncertainty = Highest value Lowest value 2 Range Once we have calculated our margin of error, we can plot it on our graph using ERROR BARS!
Error Bars also look like this! Error Bars look like this! Each error bar has a top cap and a bottom cap. The mean always goes in the middle of the error bar. The margin of error, in this case, is absolute uncertainty. Hence, the top half of the error bar equals the mean plus absolute uncertainty. And the bottom half of the error bar equals the mean minus absolute uncertainty. Note: a large error bar means the repeats are far apart, so the results are not very reliable. As opposed to a small error bar whereby the repeats are close together and the results are much more reliable (with less error). The mean plus the margin of error The Mean goes in the middle Margin of error The mean minus the margin of error Go back to your graph and add the error bars!
Discussion: Start your discussion section by restating the aim and drawing a conclusion 1. Copy/paste the words from the aim (in the rationale) 2. Edit the words to change to past tense. 3. Draw a CONCLUSION (what did the results suggest and WHY?) Restate the AIM and draw a conclusion The aim of this experiment was to determine the most suitable salt chemical to make a COLD pack when added to a controlled amount of water (10mL). The salt chemicals to choose from were Potassium Chloride, Sodium Carbonate and Sodium Bicarbonate. The results suggest [ make a COLD pack because it had the greatest drop in temperature when mixed with water. ] would be the most suitable salt chemical to Never say PROVE . Instead say the results suggest Next, provide a scientific explanation for your results. Include in-text citations as evidence you re correct. Tell us WHY?! (fill in the blank) This is BECAUSE . it absorbed the most energy when dissolved in the water. When salt dissolves, the bonds that keep salt ions together are broken apart. This separation of salt ions absorbs energy and the temperature of the solution drops. When those salt ions then bond with the water molecules, energy is released and the temperature of the solution rises. If there is more energy released than absorbed, the process is exothermic, making the solution feel warmer. In contrast, if there is more energy absorbed than released, the process is endothermic, making the solution feel cooler (author, date). These results suggest there must have been more energy absorbed than released for [ ] than for the other two salt chemicals. Remember to include a bibliography section at the end of your report for all your in-text references!
Next, EVALUATE the experimental design. 1. Discuss your margin of error (absolute uncertainty) values. 2. Discern the reliability of your results based on these values. The absolute uncertainty values - in your results table (range/2) - indicate a margin of error. In other words, if an absolute uncertainty value is small, the error (and error bar) is small. For example, imagine a dart board with the mean as the target in the middle of the dartboard. Every dart that you throw at the dart board represents one repeat or trial. If all the darts hit the same spot, that dataset will have a small margin of error, small error bar, and is therefore reliable. If, on the other hand, darts land all over the place, that dataset will have a large margin of error, large error bar, and is therefore unreliable. Each dot (or throw of the dart) represents ONE repeat. The bulls-eye represents the mean (average). Small error bar. Reliable. Large error bar. Unreliable. Complete the sentences below The absolute uncertainty value for the potassium chloride dataset is ___________________ This margin of error is [small] [large] . Hence, the potassium chloride dataset is: [reliable] [unreliable]. (select one) Hint: if margin or error is small, choose reliable . The absolute uncertainty value for the sodium carbonate dataset is ____________________ This margin of error is [small] [large] . Hence, the sodium carbonate dataset is: [reliable] [unreliable]. (select one) The absolute uncertainty value for the sodium bicarbonate dataset is __________________ This margin of error is [small] [large] . Hence, the sodium bicarbonate dataset is: [reliable] [unreliable]. (select one) If ALL the margins of error are small, then the answer to your research question is reliable. If ALL the margins of error are large, then the answer to your research question is unreliable. Is the answer to your research question reliable? [Yes] [No] (select one).
3. Identify any anomaly. 4. Discuss if you decided to keep or delete the anomaly from the dataset. An anomaly is a datapoint that will make your margin of error larger, reducing the reliability of your results. It is important to identify any anomaly because then you have to decide if you keep that datapoint in the analysis (to include in your calculation of mean and margin of error) or not. If you think the datapoint is incorrect and perhaps something went wrong when you recorded it, then you re allowed to delete it (i.e. do not include it in your calculation of mean and margin of error). Whatever you decide to do (if you keep it or delete it) the anomaly still needs to be mentioned in the discussion section of your report. Note: with only two repeats in this pre-experiment, no anomalies can be identified because there were not enough repeats (need at least 3, ideally 5, to notice it in the first place). 5. Identify the limitations to your experiment No experiment is perfect. Every experiment has its limitations. A limitation is a criticism of the experiment. It is something about the experiment that might compromise the reliability of the results (e.g. cause an anomaly!). An example of a limitation is experimenter bias. Experimenter bias is when the experimenter favors doing something a certain way, either on purpose or by mistake. It can also be when the experimenter encourages a particular outcome by modifying the findings in order to present a favored result. Other examples of a limitation include human error or a lack of reliable equipment. Both these can affect the reliability of your answer to the research question. Below, list the limitations of your experiment
The second last part of the Discussion is to suggest how to improve the experiment as well as how to extend the experiment for the next person. Suggested Improvements: Any limitations of your experimental design can now get turned into a suggestion on how to reduce the margin of error, improve reliability, and thus improve the experiment. For example, if you listed not enough repeats as a limitation, suggest more repeats! Justify all suggestions to explain how they improve the experiment. Add in-text citations (as support for your ideas). Below, link each limitation to a (justified) suggestion Extensions: What s next? Now you ve completed this experiment, what more can you discover?! Examples of extensions include: change the independent variable (e.g. change the mass instead of the type of salt) changing the dependent variable (e.g. measure temperature every 10 seconds) changing the aim (e.g. determine the best salt:water ratio for a cold pack) Below, write one extension to the experiment
The final parts to a scientific report include the Conclusion and Bibliography Conclusion: NO new information In conclusion, .. Restate key points (aim, research qu., conclusions) Allowed to copy/paste Finish the paragraph below In conclusion, the aim of this experiment was to determine the most suitable salt chemical to make a COLD pack when added to a controlled amount of water (10mL). The salt chemicals to choose from were Potassium Chloride, Sodium Carbonate and Sodium Bicarbonate. The results suggest [ ____________________ ] would be the most suitable salt chemical to make a COLD pack because it had the greatest drop in temperature when mixed with water. The values for absolute uncertainty suggest the answer to the research question is [reliable] [unreliable] (select one). Bibliography: The bibliography is a list of all the sources (e.g. books, websites) used to write your assignment. Trinity College uses Harvard style referencing. The list must be in alphabetical order by Author surname. It must include who, when, what and where you got it from in the following order: Author, Year, Title, Publisher Where (it was published) Who (Surname and initial) When (year it was published) What (in italics) Accessed 14th October 2022 <www. https://www.youtube.com/user/ScienceChannel/videos> If it s a website, also include the date it was accessed (day, month, year) and the URL of the website (in pointed brackets).
PART B: YOUR SCIENTIFIC REPORT Your task is to modify the Part A preliminary experiment to determine the best amount of your chosen chemical to make your cold pack. You will need to ensure that your experiment allows for the collection of sufficient (enough) and relevant (appropriate to your research question) data. To complete this task, you must: -develop a research question to be investigated* -conduct a risk assessment and account for risks in the methodology* -conduct the experiment* -collect sufficient and relevant data to address the research question* -process and present the data appropriately -analyse the evidence to identify trends, patterns or relationships -analyse the evidence to identify uncertainty and the limitations -interpret the evidence to draw conclusion/s to the research question -suggest possible improvements and extensions to the experiment -communicate findings in an appropriate scientific genre, i.e. scientific report. The steps indicated with an asterisk * above may be completed in groups. All other steps must be completed individually. To help you get started, the instructions you need to follow for this experiment have been done for you (see below). The introduction (next page) has also been done for you. The purpose of this assignment is to build and assess your science inquiry skills. These are skills you need to carry out scientific experiments and write up scientific reports. All draft feedback will be provided to you via this booklet. Once corrections have been made (by you), submit this booklet as your final scientific report. Make sure you check the rubric before submission! Once marked, you ll be able to keep this booklet for future reference. Instructions 1. 2. 3. 4. 5. 6. 7. 8. 9. 10. 11. 12. 13. Collect equipment and put on safety equipment (lab coat, gloves, safety glasses). Measure 10mL of water with a measuring cylinder and add to a test tube. Record the initial temperature of the water in your results table (zero seconds). Place patty paper on a balance. Press the TARE button so it reads 0.00 grams. Weigh 0.5 g of your chosen chemical (on top of the tared patty paper). Add that 0.5 grams to the water and immediately start the stopwatch. Record the temperature every 10 seconds for 60 seconds. Repeat steps 5 7, adding more salt to the (same) test tube in 0.5 gram increments. Identify when the temperature stablised. Continue to add 0.5 gram increments until you ve added 3 grams in total. Repeat steps 2 9 a further two times (three trials in total) Calculate mean (average) and absolute uncertainty (range/2) for trials 1-3 lowest temp. Pack up your station - return all equipment and clean your lab bench.
Title Author (you) Introduction (including AIM) Have you ever used a hot pack to warm your hands or a cold pack on an injury? How can something produce heat or cold without any microwaving or refrigeration involved? The answer is: chemistry. Chemical reactions that produce heat are called exothermic. The burning of fuel in a car engine is an example of an exothermic reaction. Chemical reactions that absorb heat are called endothermic. As an example of an endothermic reaction, when the chemical potassium chloride is dissolved in water, the resulting solution is colder than either of the starting materials. This kind of endothermic process is used in instant cold packs. These cold packs have a strong outer plastic layer that holds a bag of water and a chemical, or mixture of chemicals, that result in an endothermic reaction when dissolved in water. When the cold pack is squeezed, the inner bag of water breaks and the water mixes with the chemicals. The cold pack starts to cool as soon as the inner bag is broken and stays cold for over an hour. There are many different chemicals used for instant cold packs, not just potassium chloride (Riches, 2022). In the preliminary experiment it was found that [__________] was the best chemical (out of 3 tested) for a cold pack. But, how much of it do we need? The aim of this experiment is to . (finish this sentence) . DRAFT FEEDBACK/CHECKLIST The title summarises the report Beneath the title is the name of the person who wrote it. The introduction introduces the contents within the report (this has been done for you already). The introduction includes the AIM. Is it worded, The aim of this report is to .. The introduction includes one or more in-text citations. The in-text citations are properly referenced (Author, date). The full stop is AFTER the end bracket of an in-text citation.
Independent Variable Dependent Variable Controlled variable/s What is your experiment is trying to answer? Hint: Needs to include the independent, dependent and controlled variables for your experiment. Try and make it as specific as possible. Research Question Hypothesis If ..then ..because ..(in-text citation). DRAFT FEEDBACK/CHECKLIST The research question includes the dependent variable (what you record as data on your results table) The research question includes the independent variable (what changed in the experiment) The research question has a question mark. The research question is VERY specific. The research question has enough detail (e.g. exact amounts, etc.) The hypothesis is formatting using the words, if ..then .because ... The hypothesis answers the research question. The hypothesis states WHY (after because .. ) The hypothesis features an in-text citation.
Materials Chemical: Measuring cylinder and pipette test tube and test tube holder thermometer Cup cake patty paper Electronic balance or scale 30mL Water Write your chemical above Write your methodology using the instructions provided (3 pages back) . Make sure it is in past tense and third person. Methods DRAFT FEEDBACK/CHECKLIST The method is in third person (No I or We ) The method is in past tense (as though it has already happened) There is enough detail for someone else to repeat the exact same experiment based on your methods. The chosen chemical is suitable for this experiment and informed by pre-experiment results.
Justification of Modifications The provided method is an alteration from the original one. It has been redirected (the aim has been changed to ensure the data answers the (new) research question) and it has been refined (the method changed to make the collected data more accurate and reliable). Explain and Justify how the method has been redirected The preliminary experiment has been redirected by changing the aim by changing both the independent and dependent variable. Explain what those changes to the variables are (specifically) below. Then, justify how these changes redirect the preliminary experiment. Explain and Justify how the method has been refined How has the preliminary experiment been refined? Hint: number of repeats/trials, different equipment used? How should these changes make the data more accurate and reliable? DRAFT FEEDBACK/CHECKLIST The method includes how the preliminary experiment was redirected and WHY The method includes how the preliminary experiment was refined and WHY
Labelled diagram of experimental design Figure 1: labelled diagram of experimental design Risk Assessment Risk Control Emergency Action DRAFT FEEDBACK/CHECKLIST The method includes a detailed labelled diagram of the experimental design. The labelled diagram includes a caption at the bottom of the diagram. The method includes a risk assessment table outlining 3 possible risks, controls & emergency actions.
Note: your first set of results will be recorded using the first column only in every table (going down) as this is TRIAL 1. Results (raw data) Table 1: 0.5 gram of salt in 10mL of water Trial 1 Trial 2 Trial 3 Time (sec) Temperature (degrees C) Time (sec) Temperature (degrees C) Time (sec) Temperature (degrees C) 0 0 0 10 10 10 20 20 20 30 30 30 40 40 40 50 50 50 60 60 60 Highlight when the temperature stablized. Table 2: 1.0 gram of salt in 10mL of water (after adding another 0.5 grams) Trial 1 Trial 2 Trial 3 Time (sec) Temperature (degrees C) Time (sec) Temperature (degrees C) Time (sec) Temperature (degrees C) 0 0 0 10 10 10 20 20 20 30 30 30 40 40 40 50 50 50 60 60 60 Highlight when the temperature stablized.
Results (raw data) Table 3: 1.5 gram of salt in 10mL of water (after adding another 0.5 grams) Trial 1 Trial 2 Trial 3 Time (sec) Temperature (degrees C) Time (sec) Temperature (degrees C) Time (sec) Temperature (degrees C) 0 0 0 10 10 10 20 20 20 30 30 30 40 40 40 50 50 50 60 60 60 Highlight when the temperature stablized. Table 4: 2.0 gram of salt in 10mL of water (after adding another 0.5 grams) Trial 1 Trial 2 Trial 3 Time (sec) Temperature (degrees C) Time (sec) Temperature (degrees C) Time (sec) Temperature (degrees C) 0 0 0 10 10 10 20 20 20 30 30 30 40 40 40 50 50 50 60 60 60 Highlight when the temperature stablized.
Results (raw data) Table 5: 2.5 gram of salt in 10mL of water (after adding another 0.5 grams) Trial 1 Trial 2 Trial 3 Time (sec) Temperature (degrees C) Time (sec) Temperature (degrees C) Time (sec) Temperature (degrees C) 0 0 0 10 10 10 20 20 20 30 30 30 40 40 40 50 50 50 60 60 60 Highlight when the temperature stablized. Table 6: 3.0 gram of salt in 10mL of water (after adding another 0.5 grams) Trial 1 Trial 2 Trial 3 Time (sec) Temperature (degrees C) Time (sec) Temperature (degrees C) Time (sec) Temperature (degrees C) 0 0 0 10 10 10 20 20 20 30 30 30 40 40 40 50 50 50 60 60 60 Highlight when the temperature stablized.
Processed Results Copy the highlighted data from Tables 1-6 (when temperature stabilized) into Table 7 below. Table 7: When the temperature stablized Absolute uncertainty Trial 1 Trial 2 Trial 3 Mean Mass (g) Lowest temp. (degrees C) Mass (g) Lowest temp. (degrees C) Mass (g) Lowest temp. (degrees C) Lowest Temp. Range/2 0 0 0 0.5 0.5 0.5 1 1 20 1.5 1.5 1.5 2 2 2 2.5 2.5 2.5 3 3 3 Copy the mean lowest temperature values for each mass from Table 7 into Table 8 below. Table 8: Mean lowest temperature for each mass of salt Mass (g) (x-axis) 0 0.5 1 1.5 2 2.5 3 Mean Lowest Temp. (deg. C) (y-axis) Look! These are the (x:y) co-ordinates for your scatterplot graph!
Results (description of observations) What was the answer to the research question? Was the hypothesis correct or incorrect? Results (text) DRAFT FEEDBACK/CHECKLIST Every table has a title (and is numbered correctly) stating the correct amount of salt added. The tables of results includes all the raw data that was collected. The mean (average) has been calculated and is correct. Absolute uncertainty has been calculated and is correct (absolute uncertainty = range / 2). The results include quantitative data (tables) as well as qualitative (observational) data. The results (text) start with the answer to the research question. The results (text) state if the hypothesis was correct or incorrect.
Use the (x,y) co-ordinates on the previous page to make a scatterplot graph. Add a line of best fit (a straight line that goes through all the dots). Results (graph) Mean lowest temperature (degrees C) Mass (grams) Figure 2: _________________________________________________________________ DRAFT FEEDBACK/CHECKLIST The graph is the correct choice of graph for answering the research question (i.e. scatterplot graph) The graph presents the averages, NOT the raw data. The graph includes error bars that represent the values calculated for absolute uncertainty. The scale (numbering) on the x-axis and y-axis is appropriate for communicating the results. The graph has a caption (at the bottom of the graph) outlining what is in the graph. Figure 2: _______ The graph has a chart title that is succinct, valid and accurate. The graph has all information necessary to be able to interpret the graph and is easy to read.
Discuss trends, patterns, relationships, anomalies, margins or error. Do NOT explain WHY. Results (text) DRAFT FEEDBACK/CHECKLIST The results (text) identify any trends, patterns or relationships. The results (text) identify any anomalies (or states there were no anomalies). The results (text) state if an anomaly was deleted from the dataset or not (if applicable). Remember, they must be deleted before the mean and absolute uncertainty values are calculated! The results (text) identify the margins of error (clearly stating all values for absolute uncertainty). The results do NOT explain WHY (that goes in the discussion). They only state WHAT happened.
Restate the aim. Draw your conclusion/s. Explain WHY. Provide scientific explanations for the results. Include in-text citations. Discussion DRAFT FEEDBACK/CHECKLIST The discussion restates the aim (converted to past tense) The discussion draws a conclusion (what the results suggest and WHY) The discussion provides a scientific explanation for the results. The scientific explanations are supported by in-text citations (Author, date).
Discuss the RELIABILITY of your results. Identify all limitations of the experiment (in detail). Evaluation of Experimental Design DRAFT FEEDBACK/CHECKLIST The discussion talks about the reliability of the results, referencing margin of error (range/2) values. The discussion states if any anomalies were deleted (if applicable) and WHY. The discussion identifies all the limitations of the experiment (in detail).
Make a suggestion for each limitation previously mentioned. Suggested Improvements You have done a pre-liminary experiment (part A) and a modified experiment (part B) what is another experiment you could do?! Extension/s DRAFT FEEDBACK/CHECKLIST The discussion provides valid suggested improvements for the experiment. Each suggested improvement is justified (WHY it will improve the experiment). The justifications for the suggested improvements are supported by in-text citations. The discussion provides one or more valid extensions to the experiment. Each extension is justified. The justifications for the extensions are supported by in-text citations.
Restate the aim and/or research question and the conclusion (key results from this experiment). Literally COPY/PASTE! Conclusion List in alphabetical order as per author surname. Include ALL in text citations. Bibliography DRAFT FEEDBACK/CHECKLIST The conclusion starts with the words, In conclusion, The conclusion includes no new information. The conclusion restates key pieces of information from the report:- the aim and/or research question and/or conclusion. The conclusion has copy/paste from the report (may have minor edits, e.g. to convert to past tense). The bibliography is formatted correctly using Harvard style formatting. The bibliography is in alphabetical order as per author surname. The bibliography includes all sources of information that were provided as in-text citations.
Year 9 Science (Chemistry) Marking Criteria Sheet Task A B C D E Hypothesis)Formulated an aim and specific Formulated an aim and research question and informed hypothesis that can be investigated scientifically Formulated an aim and research question and hypothesis that can be investigated scientifically Partially formulated an aim and research question and/or hypothesis Mentioned an aim or research question or hypothesis Questioningand (Aim, Research Question and and detailed research question and justified hypothesis that can be investigated scientifically predicting Succinct and detailed description of methods that outline how to collect and record data systematically and accurately. Detailed description of methods that outline how to collect and record data systematically and accurately. Description of methods that outline how to collect and record data. List of Instructions and/or materials. Incomplete list of instructions and/or materials. Partially completed methodology. Diagram of experimental design (Methods) Detailed and labelled diagram of experimental design Labelled diagram of experimental design Completed risk assessment. Planning and Conducting Partially completed assessment. Relevant and detailed risk assessment. Detailed risk assessment. Methodology complete. Detailed methodology in past tense and third person. Methodology in past tense or third person. The systematic and accurate collection and recording of all quantitative data (Table of results) and qualitative data (observations). The accurate collection and recording of all quantitative data (Table of results). The collection and recording of all data. The partial collection and recording of data. Limited data collection. (Results) Large margins of error. Low to medium margins of error. Two or more anomalies. Low margins of error. One anomaly. Zero anomalies. Thorough analysis of trends and patterns in data, including a detailed and accurate description of the relationship between mass and temperature. Informed analysis of trends and patterns in data, including an accurate description of the relationship between mass and temperature. Analysis of trends and/or patterns in data, including a description of the relationship between mass and temperature. Trends, patterns and/or relationships identified. Data is mentioned Science Inquiry Skills (SIS) Processing andanalysing data and information Attempted calculation of mean and/or absolute uncertainty. (Results) Consistent and accurate calculation of mean and absolute uncertainty for all mass amounts. Calculation of mean and absolute uncertainty. Accurate calculation of mean and absolute uncertainty for most mass amounts. Graph. Comprehensive, relevant and accurate graph, easy to interpret. Confusing Graph. Explanatory graph. Justified conclusion/s with scientific explanation/s of results. Conclusion/s with explanation/s of results. Explanation of results. Statement about the results Results are mentioned elsewhere (Discussion) Conclusions consistent with evidence. Critical evaluation of the reliability of the experiment. Informed evaluation of the reliability of the experiment. Evaluation of the reliability of the experiment. Statements about methods and data 1-2 valid limitations (Discussion) Evaluating >2 valid limitations >2 valid and justified suggested improvements. 1 limitation 1 suggested improvement. 1 extension. 1-2 valid suggested improvements 1 valid extension 1 valid and justified extension. (Conclusion, Bibliography & Concise and accurate conclusion. Correctly formatted bibliography and in-text citations from 3-4+ valid and trustworthy sources. Concise (short) sentences. Concise and coherent use of appropriate language and accurate representations when communicating findings and ideas. Accurate conclusion. Bibliography and in-text citations from 3-4 sources. Coherent use of appropriate language and accurate representations when communicating findings and ideas. Conclusion. Bibliography and/or in- text citations from 1-2 sources. Use of appropriate language and representations when communicating findings and ideas. Use of everyday language and representations when communicating findings and ideas. Fragmented use of language and representat ions. language throughout) Communicating


 Results Table below")


")
")

")
 co-ordinates on the previous page to make a")


 Marking Criteria Sheet")