This study examines the divergence between the Standardized Precipitation Index (SPI) and Standardized Precipitation Evapotranspiration Index (SPEI) in defining droughts across various climatic zones of India. Analysis of long-term meteorological data indicates an increase in drought hazard over the past six decades, with specific regions like Gujarat, Rajasthan, Tamil Nadu, and Andhra Pradesh being more prone to drought episodes. The research evaluates the evolution of drought likelihood through various indices and methodologies, providing insights into the changing climate variability impacting drought patterns in India.
Please find below an Image/Link to download the presentation.
The content on the website is provided AS IS for your information and personal use only. It may not be sold, licensed, or shared on other websites without obtaining consent from the author. If you encounter any issues during the download, it is possible that the publisher has removed the file from their server.
You are allowed to download the files provided on this website for personal or commercial use, subject to the condition that they are used lawfully. All files are the property of their respective owners.
The content on the website is provided AS IS for your information and personal use only. It may not be sold, licensed, or shared on other websites without obtaining consent from the author.
E N D
Presentation Transcript
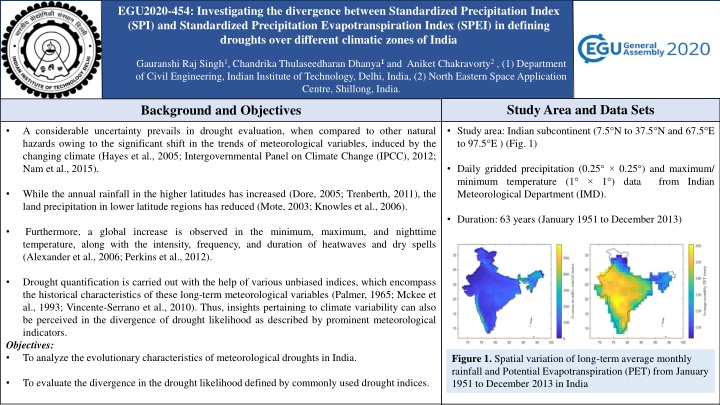
EGU2020-454: Investigating the divergence between Standardized Precipitation Index (SPI) and Standardized Precipitation Evapotranspiration Index (SPEI) in defining droughts over different climatic zones of India Gauranshi Raj Singh1, Chandrika Thulaseedharan Dhanya1and Aniket Chakravorty2 , (1) Department of Civil Engineering, Indian Institute of Technology, Delhi, India, (2) North Eastern Space Application Centre, Shillong, India. Study Area and Data Sets Background and Objectives A considerable uncertainty prevails in drought evaluation, when compared to other natural hazards owing to the significant shift in the trends of meteorological variables, induced by the changing climate (Hayes et al., 2005; Intergovernmental Panel on Climate Change (IPCC), 2012; Nam et al., 2015). Study area: Indian subcontinent (7.5 N to 37.5 N and 67.5 E to 97.5 E ) (Fig. 1) Daily gridded precipitation (0.25 0.25 ) and maximum/ minimum temperature (1 1 ) data from Indian Meteorological Department (IMD). While the annual rainfall in the higher latitudes has increased (Dore, 2005; Trenberth, 2011), the land precipitation in lower latitude regions has reduced (Mote, 2003; Knowles et al., 2006). Duration: 63 years (January 1951 to December 2013) Furthermore, a global increase is observed in the minimum, maximum, and nighttime temperature, along with the intensity, frequency, and duration of heatwaves and dry spells (Alexander et al., 2006; Perkins et al., 2012). Drought quantification is carried out with the help of various unbiased indices, which encompass the historical characteristics of these long-term meteorological variables (Palmer, 1965; Mckee et al., 1993; Vincente-Serrano et al., 2010). Thus, insights pertaining to climate variability can also be perceived in the divergence of drought likelihood as described by prominent meteorological indicators. Objectives: To analyze the evolutionary characteristics of meteorological droughts in India. Figure 1. Spatial variation of long-term average monthly rainfall and Potential Evapotranspiration (PET) from January 1951 to December 2013 in India To evaluate the divergence in the drought likelihood defined by commonly used drought indices.
Methodology Results and Discussion Evolution of meteorological droughts in India: Evolution of meteorological drought in India: Evaluation of Standardized Precipitation Index (SPI) and the Standardized Precipitation Evapotranspiration Index (SPEI), following the steps developed by Mckee et al. in 1993 and Vincente Serrano et al., in 2010, respectively. The decadal variation of DHI by SPI (Figure 2a) and SPEI (Figure 2b) reveals that drought hazard has magnified over India for the past sixty-three years. Decades of 1961 to 1970, 1971 to 1980 and 2001 to 2013 showcase the highest drought hazard. Evaluation of the Drought Hazard Index (DHI) (Maccioni et al., 2015), by amalgamating important physical drought characteristics like maximum drought magnitude, maximum drought duration and maximum drought frequency. DHI is estimated for both SPI and SPEI. The north-western states of India like Gujarat, Rajasthan, Uttar Pradesh, Punjab, Haryana and the southern states of Tamil Nadu, Andhra Pradesh and Telangana are most prone to drought episodes. Analysis of long-term trend in the meteorological variables of average annual precipitation and average annual temperature utilising the Mann Kendall test (Mann, 1945; Kendall, 1975). The magnitude of slope was evaluated using the Sen s Slope method (Sen, 1968). Evolution in the divergence of drought likelihood: Quantification of the normalized divergence in the percentage area under drought, as defined by SPI and SPEI, in different climate zones of India. Utilising the Multidimensional Ensemble Empirical Mode Decomposition (MEEMD, Wu et al., 2009), the residue difference for the moving average correlation between SPI and SPEI, precipitation (P), potential evapotranspiration (PET) and net precipitation (D), was evaluated. Figure 2. (a) Decadal variation of DHI as represented by SPI12 (b) Decadal variation of DHI as indicated by SPEI12
Results and Discussion The year 1978 forms the breakpoint (based on slope change from negative to positive) of increasing divergence, which is also highlighted in prior results. The late 1970s mark the breakpoint of the increasing divergence between SPI and SPEI, the latter describing a higher drought hazard (Figure 3). Figure 3. Temporal variation of DHI as indicated by SPI12 and SPEI12 Trend analysis: The trends exhibited by the climate variables, explain the temporal divergence shown by SPI and SPEI. While the annual precipitation series exhibits a falling trend of -1.519 (Figure 4a), the average yearly temperature series (Figure 4b) can be divided into three realizations based on different trend behaviour: Figure 4. (a) Linear trend in the variation of average annual precipitation series from 1951 to 2013 (b) Linear trend in the variation of yearly average temperature series from 1951 to 2013 (c) Division of yearly temperature trend into three segments: (i) falling (ii) no trend (iii) rising falling for the 1951 to 1975 period, no trend for the 1976 to 1990 period, and rising for the 1991 to 2013 period (Figure 4c).
Results and Discussion The possible reasons behind the divergence behaviour observed in Figure 5 are explored by analysing the MEEMD trend in the moving average correlation series of SPI and SPEI (Figure 6). Divergence in the drought likelihood India is divided into six climatic zones (Tropical monsoon, tropical wet and dry, hot desert, semi arid, humid subtropical and subtropical highland), and the normalized divergence in the evolution percent drought area represented by SPI and SPEI is evaluated for each climate zone. The moving average correlation series is created by taking a 20-year window and a 1-year lag-time. Patches of an increasing trend, describing higher correlation are noticed in the north-western and central portions of India. Thus, a tendency of reducing divergence in the arid and semi-arid zones of India can be inferred. The dominance of SPI and SPEI is synonymous to the negative and positive divergence values, respectively. A decrease in the divergence between SPI and SPEI is observed for the arid and the semi-arid zones, while enhancement is detected in the tropical monsoon and the tropical wet and dry climate zones (Figure 5). Figure 5. Normalized divergence percentage area under drought by SPI and SPEI in different climate zones of India in the Figure 6. MEEMD trend in the moving average correlation between SPI and SPEI.
Results and Discussion The reasons behind the reduction of divergence in the arid and semi-arid regions were explored using the MEEMD analysis of the driver variables (P, PET, P-PET). Spatial variation of MEEMD residue reveals that in general, while monthly precipitation has increased in the western parts of India and has reduced in the eastern regions (Figure 7a), PET has diminished in north-western India and has increased in the southern and eastern India (Figure 7b). The spatial variation of the trend in the monthly water balance (P-PET) reveals that while the regions of the Western Ghats and Northeastern hills are experiencing a water-deficit, the northwestern part of India has an enhanced water balance (Figure 7c). (a) (b) (c) Figure 7. (a) MEEMD trend in (a) Precipitation, (b) PET and (c) water balance (P-PET).
Knowles N., Dettinger M.D. & Cayan D.R. 2006. Trends in snowfall verses rainfall in the western United States. Journal of Climate, 19, 4545-4559. Maccioni P., Kossida M., Brocca L. & Moramarco T. 2015. Assessment of the drought hazard in the Tiber River Basin in Central Italy and a comparison of new and commonly used meteorological indicators. Journal of Hydrologic Engineering, 20(8), 05014029: 1-11. Mann H.B. 1945. Nnparametric tests against trend, Econometrica, 13(3), 245-259. McKee T.B., Doesken N.J. & Kleist J. 1993. The relationship of drought frequency and duration to time scales. Proceedings of the IX Conference on Applied Climatology. American Meteorological Society: Boston, MA; 179 184. Mote P.W. 2003. Trends in snow water equivalent in the Pacific Northwest and their climatic causes. Geophysical Research Letters, 30 (12), 1-4. Nam W.H., Hayes M.J., Svoboda M.D., Tadesse T. & Wilhite D.A. 2015. Drought hazard assessment in the context of climate change for Korea, Agricultural Water Management, 160, 106-117. Palmer W.C. 1965. Meteorological Drought, U.S. Weather Bureau, Research Paper Number 45, 55. Perkins S.E., Alexander L.V. & Nairn J.R. 2012. Increasing frequency, intensity and duration of observed global heatwaves and warm spells, Geophysical Research Letters, 39(20), 1-5. Sen P.K. 1968. Estimates of the regression coefficient based on Kendall s tau, Journal of the American Statistical Association, 63, 1379 1389 Trenberth K.E. 2011. Changes in precipitation with climate change, Climate Research, 47, 123-128. Vicente Serrano S.M., Beguer a, S. & L pez Moreno J.I. 2010b. A multiscalar drought index sensitive to global warming: the standardized precipitation evapotranspiration index. Journal of Climate. 23: 1696 1718. Wu Z., Huang N.E.& Chen X. 2009. The Multi-dimensional Ensemble Mode Decomposition Method, Advances in Adaptive Data Analysis, 1, 339-372. Acknowledgements Conclusions The overall meteorological drought hazard has magnified over India in the past few decades, especially since the 1970s. A strong regional divergence exists in India. The North-western and South- central parts of India are most prone to the occurrence of droughts. A strong disagreement exists in the definition of drought likelihood by SPI and SPEI in the wet climatic zones of India observed in the Western Ghats and the North-Eastern regions. A reduced divergence exists in the dry regions of Rajasthan and Deccan Plateau. The divergence behaviours aligns with evolution of wet climatic zones of India as dry and the drier climatic zones of India as wet. References Alexander L., Zhang X., Peterson T., Caesar J., Gleason B., Klein Tank A., Haylock M., Collins D., Trewin B., Rahimzadeh F., Tagipour A., Ambenje P., Rupa Kumar K., Revadekar J. & Griffiths G. 2006. Global observed changes in daily climate extremes of temperature, Journal of Geophysical Research: Atmospheres, 111(D5), 1-22. Dore M. H. I. 2005. Climate change and changes in global precipitation patterns: what do we know? Environment International, 31(8), 1167 1181. Hayes M.J., Svoboda M., Le Comte D., Redmond K.T. & Pasteris P. 2005. Drought and Water Crises: Science Technology and Management Issues, Chapter 3: Drought monitoring: New tools for the 21st century, 53-69. IPCC. 2012. Managing the Risks of Extreme Events and Disasters to Advance Climate Change Adaptation. A Special Report of Working Groups I and II of the Intergovernmental Panel on Climate Change (IPCC). Kendall M.G. 1975. Rank Correlation Methods, 5th Edition, Oxford University Press, London. The work was supported by the funds received from Science and Engineering Research Board (SERB), DST, India, under the SERB Women Excellence Award Scheme (Grant No.: SB/WEA-04/2017).