Investigating Factors Behind Railway Crossing Accidents in Japan
Explore the research conducted by Xiuzhu Gu and Atsutoshi Nakai from the Tokyo Institute of Technology on factors contributing to railway crossing accidents in Japan. The study analyzes data on railway crossing records and accident reports to uncover important insights into the causes of these incidents over the years.
Download Presentation

Please find below an Image/Link to download the presentation.
The content on the website is provided AS IS for your information and personal use only. It may not be sold, licensed, or shared on other websites without obtaining consent from the author. If you encounter any issues during the download, it is possible that the publisher has removed the file from their server.
You are allowed to download the files provided on this website for personal or commercial use, subject to the condition that they are used lawfully. All files are the property of their respective owners.
The content on the website is provided AS IS for your information and personal use only. It may not be sold, licensed, or shared on other websites without obtaining consent from the author.
E N D
Presentation Transcript
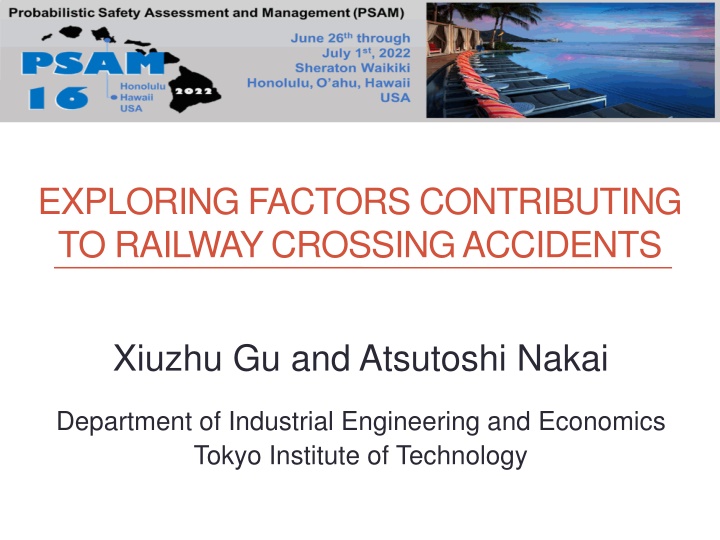
EXPLORING FACTORS CONTRIBUTING TO RAILWAY CROSSINGACCIDENTS Xiuzhu Gu and Atsutoshi Nakai Department of Industrial Engineering and Economics Tokyo Institute of Technology
2 Introduction Railway Crossing in Japan Around 33000 in total Railway Crossing by Kamakura-Koko-Mae Station Railway crossing accidents 1. Train involved 2. Train uninvolved
3 Background Number of railway crossing accidents Number of injured Number of death 1999 2019 Ministry of Land, Infrastructure, Transport and Tourism, Japan Objective To explore the important factors that contribute to railway crossing accidents.
4 Methods Two sets of data were collected and analyzed 1.1479 railway crossing records (Ministry of Land, Infrastructure, Transport and Tourism; 2016) 2. 61 railway crossing accident reports (Japan Transport Safety Board; published from 2001 to 2020)
5 Methods Railway crossing records Characteristics of the crossing Traffic volume Number of accidents (in the past five years) Train involved Train uninvolved
6 Methods Definitions of binary variables (Yes or No) Variables Definition Crossings that can optimize the blocking time. Smart crossing A device that can notify hindrances near the railway crossings. Hindrance notification device Crossings that have 50,000 or more daily vehicle traffic blocking. Vehicle bottleneck Crossings that the daily traffic blocking for vehicles and pedestrian is 50,000 or more, in which the amount for pedestrian blocking is 20,000 or more. Pedestrian bottleneck
7 Methods Definitions of continuous variables Variables Definition Crossing length (m) Number of crossing railway tracks The angle of the center lines of the tracks and the road. Intersection angle ( ) Blocking time in peak hours (min/h) Amount of blocked vehicles (per day) Amount of blocked pedestrians (per day) Vehicle traffic volume (per day) Pedestrian traffic volume (per day)
8 Results Railway crossing records (binary variables) 0.50 Train involved Train uninvolved Total 0.44 0.45 0.39 0.40 0.36 *** 0.34 0.35 0.33 *** 0.29 0.30 0.27 0.26 0.26 0.25 0.22 0.20 0.19 0.19 0.19 0.18 0.20 0.16 0.16 0.16 0.15 0.13 0.13 0.15 0.13 0.12 0.10 0.08 0.05 0.00 NO YES NO YES NO YES NO YES Smart crossing Hindrance notification device Vehicle bottleneck Pedestrian bottleneck
9 Results Railway crossing records (continuous variables) Variables Accident (NO) 11.80 Accident (YES) 12.53 Crossing length (m) ** < Number of crossing railway tracks 2.25 2.44 *** < 75.48 75.30 Intersection angle ( ) Blocking time in peak hours (min/h) 44.79 45.52 Amount of blocked vehicles (/day) 61110 64525 * Amount of blocked pedestrians (/day) 54470 66739 < Vehicle traffic volume (/day) 5206 4779 *** Pedestrian traffic volume (/day) 1474 2197 <
10 Methods Railway crossing accident reports Human Factors Analysis and Classification System (HFACS) (Wiegmann and Shappell; 2003) J-HAFCS (Nakamura et al., 2012) Unsafe acts Errors Violations Preconditions Environmental factors Conditions of train drivers Conditions of others Unsafe supervision Planned inadequate operations Inadequate supervision Failed to correct problem Supervisory violations Organizational influences Organizational climate Resource management Organizational process
11 Results Railway crossing accident reports (unsafe acts) 60% 56% 50% 43% 40% 30% 20% 8% 10% 7% 0% Perception errors Decision errors Perception errors Routine violations Train drivers Other than train drivers (e.g., vehicle drivers, pedestrians)
12 Results Railway crossing accident reports (preconditions) 70% 57% 60% 50% 44% 40% 36% 30% 20% 15% 11% 10% 10% 0% Impact of shields Characteristics of crossings Concentrate on one point Distraction Decrease in attention Insufficient physical adjustment ability Enviromental factors Conditions (other than train drivers)
13 Results Railway crossing accident reports (unsafe supervision) 80% 67% 70% 60% 49% 46% 50% 40% 30% 20% 15% 11% 10% 0% Inappropriate risk assessment Incorrected crossing environment issues Inappropriate policy Lack of safety information publicity Insufficient measures for safety risky people Railway company; crossing management company Other organizations
14 Results Railway crossing accident reports (organizational influences) 60% 56% 50% 40% 36% 30% 25% 20% 10% 0% Insufficient resource management Organizational climate Inappropriate business management
15 Discussion Characteristics of crossings Smart crossings More accidents (?) Pedestrians >> Vehicles Vehicle drivers Routine violations etc. Insufficient safety awareness Elderly people (super-ageing society) Perception errors Decrease in attention etc. Human-related factors
16 Implications Taking measures to pedestrian bottleneck crossings Improvement of crossing environment management Taking measures to support safety risky people Improvement of organizational safety climate Safety education to public (pedestrians, vehicle drivers)
17 Conclusions Crossing factors contributing to accidents Smart crossing Crossing length; Number of crossing railway tracks Pedestrian bottleneck Amount of blocked pedestrians Pedestrian traffic volume
18 Conclusions Unsafe acts (pedestrians; vehicle drivers) Perception errors routine violations Preconditions Environmental factors Substandard conditions of pedestrians and vehicle drivers Unsafe supervision Inappropriate risk assessment Untreated crossing environment issues Lack of safety information publicity Organizational influences Organizational climate Inappropriate business management

