Investigating Protein-Protein Interactions in Colorectal Cancer
Explore a novel inducible knockdown approach to investigate Dnmt1 protein-protein interaction networks in colorectal cancer through genomic PCR and expression confirmation techniques. Data from Emily Hannah Bowler-Barnett's thesis on proteomic analysis of Wnt and epigenetic regulatory protein networks in colorectal cancer. Images included for visualization.
Download Presentation

Please find below an Image/Link to download the presentation.
The content on the website is provided AS IS for your information and personal use only. It may not be sold, licensed, or shared on other websites without obtaining consent from the author. If you encounter any issues during the download, it is possible that the publisher has removed the file from their server.
You are allowed to download the files provided on this website for personal or commercial use, subject to the condition that they are used lawfully. All files are the property of their respective owners.
The content on the website is provided AS IS for your information and personal use only. It may not be sold, licensed, or shared on other websites without obtaining consent from the author.
E N D
Presentation Transcript
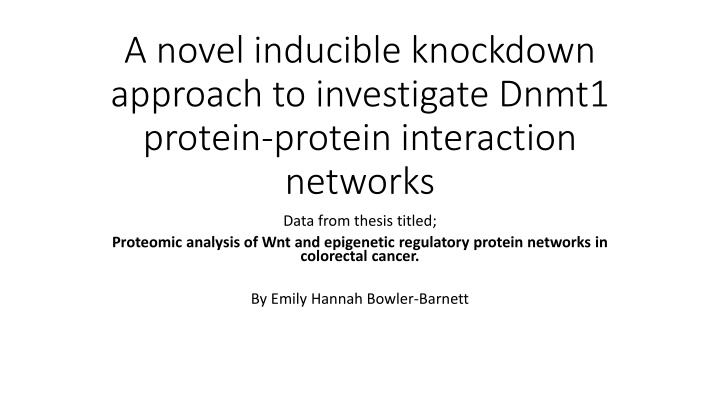
A novel inducible knockdown approach to investigate Dnmt1 protein-protein interaction networks Data from thesis titled; Proteomic analysis of Wnt and epigenetic regulatory protein networks in colorectal cancer. By Emily Hannah Bowler-Barnett
Genomic PCR of TIR1-HCT116 cells gifted from the Divecha lab with TIR1-specific primers N=3. 10 l of PCR product was run on a 0.8% agarose gel for 90 mins (80 volts) then imaged. PCR product bands at approximately 300bp indicate insertion of TIR1 into genomic DNA. +ve is TIR1 plasmid control. ve is negative control PCR (empty plasmid vector).
TIR1 expression confirmation in TIR1-HCT116 cells by PCR of cDNA with TIR1 specific primers. N=3. To confirm TIR1 expression mRNA was extracted, converted to cDNA by reverse transcriptase reaction then TIR1 amplified by sequence specific primers. 10 l of PCR products were then run on a 0.8% agarose gel, 90 mins, 80 volts. A PCR product band at approximately 300bp indicates TIR1 expression, +ve was TIR1-containing plasmid construct.
PCR of cDNA for DNMT1-FLAG-AID/Cas9 construct in puromycin selected colony. N=3. mRNA was extracted from cells, converted to cDNA using reverse transcriptase reaction, and amplified by sequence specific primers for AID insert. PCR products were then run on a 0.8% agarose gel, 90 mins, 80 volts. A PCR product band at approximately 1200bp indicates AID expression, +ve was AID-DNMT1 containing plasmid construct. ve (cells transfected with empty plasmid vector).
Genomic DNA PCR using Fw left arm and Rv right arm primers to identify insert of DNMT1-FLAG-AID. N=3. Genomic DNA was extracted from cells and amplified by sequence specific primers for DNMT1-AID. PCR products were then run on a 0.8% agarose gel, 90 mins, 80 volts. A PCR product band at approximately 300bp indicates WT Dnmt1 expression, +ve is DNMT1-FLAG- AID-containing plasmid construct following PCR with Fw and Rv primers. ve (cells transfected with empty plasmid vector)
PCR of DNA for DNMT1-FLAG-AID insert in clonal cell lines using Fw left arm and Rv right arm primers expected band of 1164bp for successfully inserted DNMT1-FLAG-AID. N=3. DNA was extracted following clonal selection of cells and amplified by sequence specific primers for DNMT1-AID-FLAG insert. Lane 54 negative control (cells transfected with empty plasmid vector). Lane 55/56 positive control (plasmid construct containing AID insert) with PCR band with an expected size of approximately 1200bp. Lane 56 contast inverted to improve image clarity (image faint due to faulty imager light source).
PCR of genomic DNA using primers Fw upstream intron and Rv 1140 AID primers. Expected product size of 772bp for successful insert. N=3. DNA was extracted following clonal selection of cells and amplified by sequence specific primers for DNMT1-FLAG-AID insert. PCR products were then run on a 0.8% agarose gel, 90 mins, 80 volts. Cells transfected with an empty vector were used as negative control (-ve). DNMT1-FLAG-AID-containing plasmid construct was used as primer test.
TIR1 expression confirmation in TIR1-HCT116 cells by PCR of cDNA with TIR1 specific primers - whole gel image. To confirm TIR1 expression mRNA was extracted, converted to cDNA by reverse transcriptase reaction then TIR1 amplified by sequence specific primers. PCR products were then run on a 0.8% agarose gel, 90 mins, 80 volts. A PCR product band at approximately 300bp indicates TIR1 expression, +ve was TIR1-containing plasmid construct (Lanes 3 and 4). TIR1-HCT116-1 and TIR1-HCT116-2 cell lines are HCT116 cell populations that were virally transduced via the same protocol but on two different occasions. TIR1-HCT116-1 was the cell population taken forward in the development of the DNMT1-FLAG-AID cell line. Two DNA ladders were added to this gel to mitigate issues with ladders used previously in the lab. Two positive TIR1 plasmids were used to double check that the glycerol stock that had been generated from the Divecha lab TIR1 expression plasmid stock had been successful.


