Investigating Viability of Regional Water CCO
This draft document explores the financial benefits of establishing a Regional Water CCO involving four councils in the Bay of Plenty region. It discusses lower costs, improved access to funding, regulatory compliance, and sustainability advantages for water services provision. The report emphasizes the potential advantages for councils, ratepayers, and communities in adopting a Regional Water CCO model.

Download Presentation

Please find below an Image/Link to download the presentation.
The content on the website is provided AS IS for your information and personal use only. It may not be sold, licensed, or shared on other websites without obtaining consent from the author.If you encounter any issues during the download, it is possible that the publisher has removed the file from their server.
You are allowed to download the files provided on this website for personal or commercial use, subject to the condition that they are used lawfully. All files are the property of their respective owners.
The content on the website is provided AS IS for your information and personal use only. It may not be sold, licensed, or shared on other websites without obtaining consent from the author.
E N D
Presentation Transcript
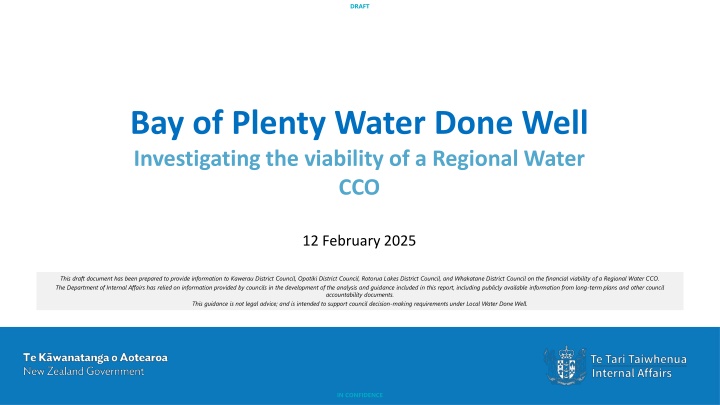
DRAFT Bay of Plenty Water Done Well Investigating the viability of a Regional Water CCO 12 February 2025 This draft document has been prepared to provide information to Kawerau District Council, Opotiki District Council, Rotorua Lakes District Council, and Whakatane District Council on the financial viability of a Regional Water CCO. The Department of Internal Affairs has relied on information provided by councils in the development of the analysis and guidance included in this report, including publicly available information from long-term plans and other council accountability documents. This guidance is not legal advice; and is intended to support council decision-making requirements under Local Water Done Well. IN CONFIDENCE
DRAFT Executive Summary benefits from establishing a Regional Water CCO A Regional Water CCO consisting of Kawerau, Opotiki, Rotorua, and Whakatane councils ( the four councils ) will have substantial benefits for councils, ratepayers and communities. The key difference between a four-council model and the six-council Bay of Plenty model is that a smaller regional Water CCO will likely require a higher free funds from operations to net debt ratio covenant than a larger organisation, though this would only have a marginal impact on minimum revenue requirements and water bills. For modelling purposes we have assumed a minimum FFO to net debt of 9% for this group, compared to 8% for the wider Bay of Plenty model including Tauranga and Western Bay of Plenty. The analysis from this earlier work has been updated for this key difference, and presented in this pack. The substantial benefits that could be achieved through the establishment or a regional Water CCO are the same as outlined for the six-council Bay of Plenty scenario analysed previously. These benefits apply to any regional amalgamated Water CCO of a certain scale, compared to individual council delivery. A Regional Water CCO comprising of the four councils: Could deliver water services at lower cost to consumers than can be achieved by individual councils. Can access more debt financing than councils through LGFA. This enables an immediate uplift in access to funding, enables the costs of assets to be spread over their useful lives (through debt financing new assets), and providing additional cash reserves and flexibility. Can meet expected borrowing covenants as signalled by LGFA, and access debt financing on improved terms against status quo council borrowing arrangements. Would ensure financially sustainable water services provision to consumers, provide resilience, and enable uplifts in water services infrastructure investment over time. Enables the adoption of fit-for-purpose investment, asset management and financing strategies for water services delivery, which will be more efficient than council in- house delivery. Ensures compliance with ringfencing, financial sustainability and other financial principle requirements under Local Water Done Well. Would be the regulated party for water quality regulation and economic regulation. By establishing a water CCO, councils become beneficiaries of the regulatory regime. Enables the refinancing of water services borrowings off council balance sheets, resulting in a material improvement in the financial sustainability and resilience of councils. This creates substantial borrowing headroom for councils, which can allow general rates to be reduced. These benefits can be realised without requiring price harmonisation across councils, cross-subsidisation, or shareholding councils having to guarantee each other s proportion of the CCO s borrowings. These are all important establishment considerations, and it is in councils discretion as to how pricing and debt structuring parameters are set. IN CONFIDENCE 2 Updated for Regional group consisting of the four councils
DRAFT Executive Summary lower charges, financial sustainability and regulation Lower charges to consumers achieved by a Regional Water CCO A Regional Water CCO could deliver water services at lower cost to consumers than can be achieved by individual council delivery. By FY33/34 this could result in 17% lower charges than individual council water services delivery. The savings shown below solely relate to financing efficiencies of a regional Water CCO. Further savings could be achieved through operational and capital efficiencies over time. By FY33/34 the average consumer would save $540 + GST per year from the establishment of a regional water CCO, from financing efficiency alone. Water services minimum operating revenues ($m) Water services operating revenues - in 2024-34 long-term plans Water services operating revenues - financially sustainable individual council service provision Water services operating revenues - Regional Water CCO 24/25 25/26 26/27 27/28 28/29 29/30 30/31 31/32 32/33 33/34 Total $1,158 $83 $93 $102 $109 $117 $124 $128 $131 $134 $137 $83 $96 $109 $121 $130 $132 $132 $133 $134 $134 $1,205 $83 $94 $106 $115 $122 $125 $126 $128 $130 $132 $1,162 Water services average charge per connection ($) Average water services charge across BOP councils - in 2024-34 long-term plans Average water services charge across BOP councils - financially sustainable individual council service provision Average water services charge across BOP councils - Bay of Plenty Water CCO Savings: Regional Water CCO v 2024-34 LTP / financially sustainable individual council service provision Savings as a percentage of 2024-34 long-term plan average charge 24/25 $2,130 25/26 $2,367 26/27 $2,560 27/28 $2,704 28/29 $2,901 29/30 $3,031 30/31 $3,093 31/32 $3,148 32/33 $3,185 33/34 $3,234 Total $28,352 $1,849 $2,120 $2,392 $2,626 $2,818 $2,819 $2,797 $2,791 $2,775 $2,753 $25,739 $1,844 $2,075 $2,316 $2,507 $2,636 $2,667 $2,672 $2,688 $2,696 $2,694 $24,794 $285 $292 $243 $197 $265 $365 $422 $460 $489 $540 $3,558 13% 12% 10% 7% 9% 12% 14% 15% 15% 17% 13% A Regional Water CCO can meet LGFA lending covenants A Regional Water CCO comprising of the four councils can meet expected borrowing covenants as signalled by LGFA, and access debt financing on improved terms against status quo council borrowing arrangements. This enables increased debt financing, free from council borrowing constraints, leading to lower charges to consumers. A Regional Water CCO would be financially sustainable and would be required to comply with water quality and economic regulation A Regional Water CCO has an easier pathway to financially sustainable water services provision than individual council delivery, evidenced through requiring lower revenues and charges to consumers for the same levels of operating and capital expenditure. A Regional Water CCO could also borrow longer, carry higher debt balances, and better align financing of long-lived assets with the assets lifespans, ensuring intergenerational equity. Economic regulation, in particular, will contribute to operational and capital efficiencies over time. Establishing a professional Water CCO ensures that councils as shareholders can utilise the regulatory regime to their benefit, in driving the performance expectations of the Water CCO. 3 Updated for Regional group consisting of the four councils IN CONFIDENCE
DRAFT Executive Summary refinancing water debts improves council balance sheets A Regional Water CCO enables the refinancing of water services borrowings off council balance sheets LGFA has committed to lend to water CCOs and treat their debt as separate to owning councils debt, where there is a guarantee or uncalled capital from owning councils in place, and adherence to prudent credit criteria. This means that LGFA would exclude a water CCO s water services debts from owning council s borrowing covenants (e.g., in debt to revenue calculations). Because water services are higher leveraged than other council business, establishing a Water CCO and excluding water services revenues and debts from LGFA s consideration of owning councils would create significant new borrowing headroom for each Bay of Plenty council. This results from the refinancing of water services borrowings off council balance sheets, providing a material improvement in the financial sustainability and resilience of councils. New borrowing capacity could allow general rates to be reduced, using this new borrowing capacity to fund future non-water infrastructure investment that would otherwise be rates funded. Reduction in council borrowings from establishing a Water CCO A Regional Water CCO comprising of the four councils could borrow direct from LGFA (secured against water services revenues) and provide cash to owning councils, enabling the pay down of existing council debt relating to water services. By FY33/34, council borrowings would be $458 million lower than under status quo in-house delivery arrangements (based on council LTPs). Reduction in council debt from establishing Regional Water CCO ($m) Rotorua District Council Whakatane District Council Opotiki District Council Kawerau District Council Total reduction in council debt from establishing Bay of Plenty Water CCO 24/25 25/26 26/27 27/28 28/29 29/30 30/31 31/32 32/33 33/34 $206 $87 $21 $6 $321 $230 $103 $23 $8 $364 $255 $118 $26 $9 $409 $271 $128 $30 $11 $441 $282 $130 $35 $13 $460 $283 $131 $38 $14 $466 $278 $131 $42 $14 $465 $268 $137 $47 $14 $466 $261 $138 $50 $14 $462 $253 $141 $51 $14 $458 New borrowing headroom for owning councils Due to current council debt levels, and projected investment requirements for water services infrastructure, the four councils water services are higher leveraged than other council activities. LGFA s separate treatment of water services debts (if a Water CCO is established) means that the $458 million reduction in council debt equates to $213 million of new borrowing capacity across the four councils by FY33/34 (but with a peak new capacity of $230 million). This new borrowing capacity is lower than the value of water services debts, due to water services operating revenues no longer forming part of LGFA s assessment of council covenants. Debt headroom created for councils from establishing Regional Water CCO ($m) Rotorua District Council Whakatane District Council Opotiki District Council Kawerau District Council Total council debt headroom created from establishing Regional Water CCO Peak council debt headroom created from establishing Regional Water CCO 24/25 25/26 26/27 27/28 28/29 29/30 30/31 31/32 32/33 33/34 $65 $47 $20 $6 $137 $230 $74 $51 $21 $7 $153 $86 $62 $23 $9 $179 $97 $70 $26 $11 $204 $96 $69 $29 $14 $208 $95 $62 $32 $16 $204 $93 $64 $34 $18 $208 $89 $72 $38 $18 $216 $86 $72 $39 $17 $213 $83 $75 $41 $15 $213 4 Updated for Regional group consisting of the four councils IN CONFIDENCE
DRAFT Comparing councils status quo water services delivery arrangements to a Regional Water CCO IN CONFIDENCE
DRAFT Comparison of scenarios for Rotorua Lakes District Council Assuming the LTP level of capital investment as constant ($482 million over ten years) we compare three scenarios: Scenario 1. LTP: 2024-34 LTP projections; Scenario 3. Regional Water CCO (FFO 9%): 2024-34 LTP projections, modified so that a target FFO to debt ratio of 9% is met from 1 July 2028 onwards. Scenario 2. RLDC financially sustainable (FFO 11%): 2024-34 LTP projections, modified so that a target FFO to debt ratio of 11% is met from 1 July 2028 onwards; and Further detail on these scenarios is set out in Annex 6. Water net debt to operating revenue Funds from operations to net debt for water services Explanation: FFO to net debt is the metric for determining financial sustainability, and it drives revenues, charges and borrowing requirements for water services. 500% 12.0% 10.0% 400% 8.0% 300% A higher FFO requirement means more revenues to support a given level of borrowings. 6.0% 200% 4.0% The higher the FFO, the more financially sustainable the service. 100% 2.0% 0.0% 0% This, however, needs to balanced against affordability considerations. 24/25 25/26 26/27 27/28 28/29 29/30 30/31 31/32 32/33 33/34 24/25 25/26 26/27 27/28 28/29 29/30 30/31 31/32 32/33 33/34 1. LTP 2. RLDC financially sustainable (FFO 11%) 3. Regional Water CCO (FFO 9%) 1. LTP 2. RLDC financially sustainable (FFO 11%) 3. Regional Water CCO (FFO 9%) Recommended scenarios: DIA recommends the key scenarios to form the baseline for RLDC analysis, deciding on preferred delivery model, and completing a Water Services Delivery Plan are: Average water services bill per connection (ex GST) Water services operating revenues $3,000 $90 $80 $2,500 $70 Scenario 2. RLDC financially sustainable (FFO 11%) RLDC in-house or new RLDC owned CCO with a minimum FFO to net debt ratio of 11% by 1 July 2028; and Scenario 3. Regional Water CCO (FFO 9%) A regional CCO owned by the four councils, with a minimum FFO to net debt ratio of 9% by 1 July 2028. $2,000 $60 $50 $m $1,500 $40 $1,000 $30 $20 $500 $10 $0 $0 24/25 25/26 26/27 27/28 28/29 29/30 30/31 31/32 32/33 33/34 24/25 25/26 26/27 27/28 28/29 29/30 30/31 31/32 32/33 33/34 1. LTP 2. RLDC financially sustainable (FFO 11%) 3. Regional Water CCO (FFO 9%) 1. LTP 2. RLDC financially sustainable (FFO 11%) 3. Regional Water CCO (FFO 9%) 6 Updated for Regional Water CCO FFO of 9% IN CONFIDENCE
DRAFT Comparison of scenarios for Whakatane District Council Assuming the LTP level of capital investment as constant ($213 million over ten years) we compare three scenarios: Scenario 1. LTP: 2024-34 LTP projections; Scenario 3. Regional Water CCO (FFO 9%): 2024-34 LTP projections, modified so that a target FFO to debt ratio of 9% is met from 1 July 2028 onwards. Scenario 2. WDC financially sustainable (FFO 12%): 2024-34 LTP projections, modified so that a target FFO to debt ratio of 12% is met from 1 July 2028 onwards; and Further detail on these scenarios is set out in Annex 6. Water net debt to operating revenue Funds from operations to net debt for water services Explanation: FFO to net debt is the metric for determining financial sustainability, and it drives revenues, charges and borrowing requirements for water services. 500% 14.0% 12.0% 400% 10.0% 300% A higher FFO requirement means more revenues to support a given level of borrowings. 8.0% 6.0% 200% 4.0% The higher the FFO, the more financially sustainable the service. 100% 2.0% 0.0% This, however, needs to balanced against affordability considerations. 0% 24/25 25/26 26/27 27/28 28/29 29/30 30/31 31/32 32/33 33/34 24/25 25/26 26/27 27/28 28/29 29/30 30/31 31/32 32/33 33/34 1. LTP 2. WDC financially sustainable (FFO 12%) 3. Regional Water CCO (FFO 9%) 1. LTP 2. WDC financially sustainable (FFO 12%) 3. Regional Water CCO (FFO 9%) Recommended scenarios: DIA recommends the key scenarios to form the baseline for WDC analysis, deciding on preferred delivery model, and completing a Water Services Delivery Plan are: Average water services bill per connection (ex GST) Water services operating revenues $3,500 $45 $40 $3,000 $35 $2,500 Scenario 2. WDC financially sustainable (FFO 12%) WDC in-house or new WDC owned CCO with a minimum FFO to net debt ratio of 12% by 1 July 2028; and Scenario 3. Regional Water CCO (FFO 9%) A regional CCO owned by the four councils, with a minimum FFO to net debt ratio of 9% by 1 July 2028. $30 $2,000 $25 $m $20 $1,500 $15 $1,000 $10 $500 $5 $0 $0 24/25 25/26 26/27 27/28 28/29 29/30 30/31 31/32 32/33 33/34 24/25 25/26 26/27 27/28 28/29 29/30 30/31 31/32 32/33 33/34 1. LTP 2. WDC financially sustainable (FFO 12%) 3. Regional Water CCO (FFO 9%) 1. LTP 2. WDC financially sustainable (FFO 12%) 3. Regional Water CCO (FFO 9%) 7 Updated for Regional Water CCO FFO of 9% IN CONFIDENCE
DRAFT Comparison of scenarios for Opotiki District Council Assuming the LTP level of capital investment as constant ($64 million over ten years) we compare three scenarios: Scenario 1. LTP: 2024-34 LTP projections; Scenario 3. Regional Water CCO (FFO 9%): 2024-34 LTP projections, modified so that a target FFO to debt ratio of 9% is met from 1 July 2028 onwards. Scenario 2. ODC financially sustainable (FFO 12%): 2024-34 LTP projections, modified so that a target FFO to debt ratio of 12% is met from 1 July 2028 onwards; and Further detail on these scenarios is set out in Annex 6. Explanation: FFO to net debt is the metric for determining financial sustainability, and it drives revenues, charges and borrowing requirements for water services. Water net debt to operating revenue Funds from operations to net debt for water services 700% 14.0% 12.0% 600% 10.0% 500% A higher FFO requirement means more revenues to support a given level of borrowings. 8.0% 400% 6.0% 300% 4.0% 200% The higher the FFO, the more financially sustainable the service. 2.0% 100% This, however, needs to balanced against affordability considerations. 0.0% 0% 24/25 25/26 26/27 27/28 28/29 29/30 30/31 31/32 32/33 33/34 24/25 25/26 26/27 27/28 28/29 29/30 30/31 31/32 32/33 33/34 Recommended scenarios: DIA recommends the key scenarios to form the baseline for ODC analysis, deciding on preferred delivery model, and completing a Water Services Delivery Plan are: 1. LTP 2. ODC financially sustainable (FFO 12%) 3. Regional Water CCO (FFO 9%) 1. LTP 2. ODC financially sustainable (FFO 12%) 3. Regional Water CCO (FFO 9%) Average water services bill per connection (ex GST) Water services operating revenues $6,000 $12 $5,000 $10 Scenario 2. ODC financially sustainable (FFO 12%) ODC in-house or new ODC owned CCO with a minimum FFO to net debt ratio of 12% by 1 July 2028; and Scenario 3. Regional Water CCO (FFO 9%) A regional CCO owned by the four councils, with a minimum FFO to net debt ratio of 9% by 1 July 2028. $4,000 $8 $m $3,000 $6 $2,000 $4 $1,000 $2 $0 $0 24/25 25/26 26/27 27/28 28/29 29/30 30/31 31/32 32/33 33/34 24/25 25/26 26/27 27/28 28/29 29/30 30/31 31/32 32/33 33/34 1. LTP 2. ODC financially sustainable (FFO 12%) 3. Regional Water CCO (FFO 9%) 1. LTP 2. ODC financially sustainable (FFO 12%) 3. Regional Water CCO (FFO 9%) 8 Updated for Regional Water CCO FFO of 9% IN CONFIDENCE
DRAFT Comparison of scenarios for Kawerau District Council Assuming the LTP level of capital investment as constant ($32 million over ten years) we compare three scenarios: Scenario 1. 2024-34 Baseline: baseline 2024-34 projections provided by KDC officers; Scenario 3. Regional Water CCO (FFO 9%): 2024-34 LTP projections, modified so that a target FFO to debt ratio of 9% is met from 1 July 2028 onwards. Scenario 2. KDC financially sustainable (FFO 12%): baseline projections, modified so that a target FFO to debt ratio of 12% is met from 1 July 2028 onwards; and Further detail on these scenarios is set out in Annex 6. Funds from operations to net debt for water services Water net debt to operating revenue Explanation: FFO to net debt is the metric for determining financial sustainability, and it drives revenues, charges and borrowing requirements for water services. 16.0% 400% 14.0% 12.0% 300% 10.0% A higher FFO requirement means more revenues to support a given level of borrowings. 8.0% 200% 6.0% The higher the FFO, the more financially sustainable the service. 4.0% 100% 2.0% This, however, needs to balanced against affordability considerations. 0.0% 0% 24/25 25/26 26/27 27/28 28/29 29/30 30/31 31/32 32/33 33/34 24/25 25/26 26/27 27/28 28/29 29/30 30/31 31/32 32/33 33/34 1. 2024-34 Baseline 2. KDC financially sustainable (FFO 12%) 3. Regional Water CCO (FFO 9%) Recommended scenarios: DIA recommends the key scenarios to form the baseline for KDC analysis, deciding on preferred delivery model, and completing a Water Services Delivery Plan are: 1. 2024-34 Baseline 2. KDC financially sustainable (FFO 12%) 3. Regional Water CCO (FFO 9%) Average water services bill per connection (ex GST) Water services operating revenues $2,500 $7.0 $6.0 $2,000 Scenario 2. KDC financially sustainable (FFO 12%) KDC in-house or new KDC owned CCO with a minimum FFO to net debt ratio of 12% by 1 July 2028; and Scenario 3. Regional Water CCO (FFO 9%) A regional CCO owned by the four councils, with a minimum FFO to net debt ratio of 9% by 1 July 2028. $5.0 $1,500 $4.0 $m $3.0 $1,000 $2.0 $500 $1.0 $0.0 $0 24/25 25/26 26/27 27/28 28/29 29/30 30/31 31/32 32/33 33/34 24/25 25/26 26/27 27/28 28/29 29/30 30/31 31/32 32/33 33/34 1. 2024-34 Baseline 2. KDC financially sustainable (FFO 12%) 3. Regional Water CCO (FFO 9%) 1. 2024-34 Baseline 2. KDC financially sustainable (FFO 12%) 3. Regional Water CCO (FFO 9%) 9 Updated for Regional Water CCO FFO of 9% IN CONFIDENCE
DRAFT Analysis and insights IN CONFIDENCE
DRAFT Overview of approach On 24 January 2025, the Department of Internal Affairs ( the Department ) provided Chief Executives of Bay of Plenty councils with analysis and guidance on the financial viability of a Bay of Plenty regional Water CCO, comprising Kawerau, Opotiki, Rotorua, Tauranga, Whakatane, and Westen Bay of Plenty councils. The Chief Executive of Rotorua District Council subsequently asked the Department to refresh this analysis and guidance for a four-council model consisting of Kawerau, Opotiki, Rotorua, and Whakatane councils, which is set out in this pack. Any regional Water CCO of a certain scale will have substantial benefits for councils, ratepayers and communities. The key difference between this four-council model and the six- council Bay of Plenty model is that a smaller regional Water CCO will likely require a higher free funds from operations to net debt ratio covenant than a larger organisation. For modelling purposes we have assumed a minimum FFO to net debt of 9% for this group, compared to 8% for the wider Bay of Plenty model including Tauranga and Western Bay of Plenty. The analysis from this earlier work has been updated for this key difference, and presented in this pack. Each council would benefit from the establishment of a regional Water CCO against other delivery model options. Local Water Done Well provides a significant opportunity to improve the financial sustainability of water services delivery and councils balance sheets. The New Zealand Local Government Funding Agency s (LGFA) commitment to lend to Water CCOs, and treat their debts as separate to owning councils borrowings, is key to this. LGFA will apply a funds from operations ( FFO ) to debt covenant for lending to any Water CCO1. LGFA also expect any high-growth council seeking additional borrowing capacity to either establish a Water CCO or ensure that its water services demonstrate the same financial sustainability characteristics as a separate Water CCO. The Department has assumed a minimum FFO to debt ratio of 9% for a Regional Water CCO consisting of the four councils, for modelling purposes 2. We expect that a Regional Water CCO would be able to access more favourable lending terms than single-council owned Water CCOs. A Regional Water CCO would be financially viable at LTP projected levels of revenue, debt and investment. There is no requirement for price harmonisation or cross-subsidisation between regions to make a joint model work. Establishing a Water CCO could create new balance sheet capacity of approximately $213 million across the four councils over ten years. This is due to LGFA s separate treatment of Water CCO s debts from owning councils. New balance sheet capacity for the four councils would significantly improve each councils financial positions. This could allow general rates to be reduced, using this new borrowing capacity to fund future non-water infrastructure investment that would otherwise be rates funded. Footnotes: 1. FFO to net debt is the metric for determining financial sustainability, and it drives revenues, charges and borrowing requirements for water services. A higher FFO requirement means more revenues to support a given level of borrowings. The higher the FFO, the more financially sustainable the service. This, however, needs to balanced against affordability considerations. 2. Scenarios modelled, underlying assumptions, and considerations for seeking additional borrowing capacity for high growth councils should be tested with LGFA. 11 Updated for Regional group consisting of the four councils IN CONFIDENCE
DRAFT Analysis and scenarios We have modelled various scenarios to test the financial sustainability of the four councils water services provision, using 2024-34 LTP information as the starting point (or other baseline financial information provided by councils where LTPs have been deferred for one year). We have assumed a target minimum FFO to debt ratio of 9%for the purposes of modelling a Regional Water CCO, following LGFA s guidance to the sector. Assuming the LTP level of capital investment as constant ($791 million over ten years) we compare base scenarios for each council: Scenario 1. LTP: 2024-34 LTP projections (or other baseline financial projections provided by councils); Scenario 2. Financially sustainable single-council water services delivery: 2024-34 LTP projections, modified so that a target FFO to debt ratio for an individual council s water services delivery is met from 1 July 2028 onwards; Scenario 3. Regional Water CCO:2024-34 LTP projections, modified so that a target FFO to debt ratio of 9% is met for each councils financial projections from 1 July 2028 onwards, as part of a regional Water CCO that can access more favourable lending terms from LGFA. This analysis is set out: In Annex 3 - A comparison of the four councils water services using baseline / LTP financial projections; In Annex 4 - A comparison of the four councils water services updating financial projections for a Regional Water CCO (9% FFO); and In Annex 6 - Scenarios for each councils water services provision. Commentary on the financial viability of a Regional Water CCO is set out in Annex 5. 12 Updated for Regional group consisting of the four councils IN CONFIDENCE
DRAFT Prices, operating costs and investment for a Regional Water CCO Household water charges are directly determined by proposed levels of investment, operating expenses and the utilisation of debt versus revenue funding of investment. Each council is facing trade-off decisions on these factors. The charts on this slide show projected water services bills, operating costs and investment per connection, for the four councils under a Regional Water CCO. Revenues and debt financing have been set to maintain a minimum 9% FFO to debt ratio, and the full investment programmes have been included. Higher water bills are due to higher operating costs and/or higher borrowings per connection driven by investment (and vice versa for lower water bills). Further comparative detail for the four councils is set out in annexes 3 and 4. Details on the impact on each council s revenues and debt financing from establishing a Regional Water CCO are set out in Annex 6. Regional Water CCO average water services bill per connection (ex GST) $5,000 $4,500 $4,000 $3,500 $3,000 $2,500 $2,000 $1,500 $1,000 $500 $0 24/25 25/26 26/27 27/28 28/29 29/30 30/31 31/32 32/33 33/34 Rotorua Whakatane Opotiki Kawerau Average - Regional CCO Cumulative water capital investment per connection Water opex per connection (excl interest, depn) $35,000 $2,000 $30,000 $1,600 $25,000 $1,200 $20,000 $15,000 $800 $10,000 $400 $5,000 $0 $0 24/25 25/26 26/27 27/28 28/29 29/30 30/31 31/32 32/33 33/34 24/25 25/26 26/27 27/28 28/29 29/30 30/31 31/32 32/33 33/34 Rotorua Whakatane Opotiki Kawerau Average Rotorua Whakatane Opotiki Kawerau Average 13 Updated for Regional group consisting of the four councils IN CONFIDENCE
Establishing a Water CCO will allow water revenues to directly support all water services borrowing requirements and create new borrowing headroom for owning councils LGFA has committed to lend to water CCOs and treat their debt as separate to owning councils debt, where there is a guarantee or uncalled capital from owning councils in place, and adherence to prudent credit criteria. This means that LGFA would exclude a water CCO s water services debts from owning council s borrowing covenants (e.g., in debt to revenue calculations). This creates new borrowing headroom for owning councils, as water services are higher leveraged than other council business. This slide shows notional headroom created if water is treated separately. The potential impact on each councils balance sheet from establishing a Water CCO is set out in further detail in Annex 6. Projected council net debt to operating revenue (including water services) Projected council net debt to operating revenue (excluding water services) $1,400 350% $1,400 350% Net debt to operating revenue Net debt to operating revenue $1,200 $1,200 280% 280% $1,000 $1,000 210% 210% $800 $800 $m $m $600 $600 140% 140% $400 $400 70% 70% $200 $200 $0 0% $0 0% 24/25 25/26 26/27 27/28 28/29 29/30 30/31 31/32 32/33 33/34 24/25 25/26 26/27 27/28 28/29 29/30 30/31 31/32 32/33 33/34 Net debt ($m) Borrowing headroom created ($m) Debt headroom to limit ($m) Net debt ($m) Debt headroom to limit ($m) Net debt to operating revenue (%) Borrowing limit (%) Net debt to operating revenue (%) Borrowing limit (%) Note: debt limit is set at approximately 270% which is the weighted average of the councils credit limits (a mix of 175% and 280%) Note: debt limit is set at approximately 270% which is the weighted average of the councils credit limits (a mix of 175% and 280%) New debt headroom for owning councils ($000) Rotorua District Council Whakatane District Council Opotiki District Council Kawerau District Council Total FY24/25 64,682 46,791 19,802 5,602 136,878 FY25/26 73,756 50,685 20,657 7,496 152,593 FY26/27 85,726 61,779 23,220 8,550 179,274 FY27/28 96,870 69,826 26,158 11,431 204,285 FY28/29 96,398 68,943 29,199 13,585 208,126 FY29/30 95,396 61,621 31,714 15,561 204,292 FY30/31 92,822 63,552 34,011 17,838 208,223 FY31/32 88,625 71,643 37,708 17,782 215,757 FY32/33 85,708 71,556 39,460 16,592 213,315 FY33/34 82,511 74,688 40,792 14,991 212,981 14 Updated for Regional group consisting of the four councils