Investment Analysis and Development Strategies for Gateway Cities in Massachusetts
Explore the significant state investments made in Gateway Cities of Massachusetts from FY09 to FY13, focusing on areas like educational facilities, economic development, housing, and more. Discover key findings, challenges faced by Gateway Cities, and proposed transformative development ideas for sustainable growth and renewal, backed by case studies and analysis.
Download Presentation

Please find below an Image/Link to download the presentation.
The content on the website is provided AS IS for your information and personal use only. It may not be sold, licensed, or shared on other websites without obtaining consent from the author. If you encounter any issues during the download, it is possible that the publisher has removed the file from their server.
You are allowed to download the files provided on this website for personal or commercial use, subject to the condition that they are used lawfully. All files are the property of their respective owners.
The content on the website is provided AS IS for your information and personal use only. It may not be sold, licensed, or shared on other websites without obtaining consent from the author.
E N D
Presentation Transcript
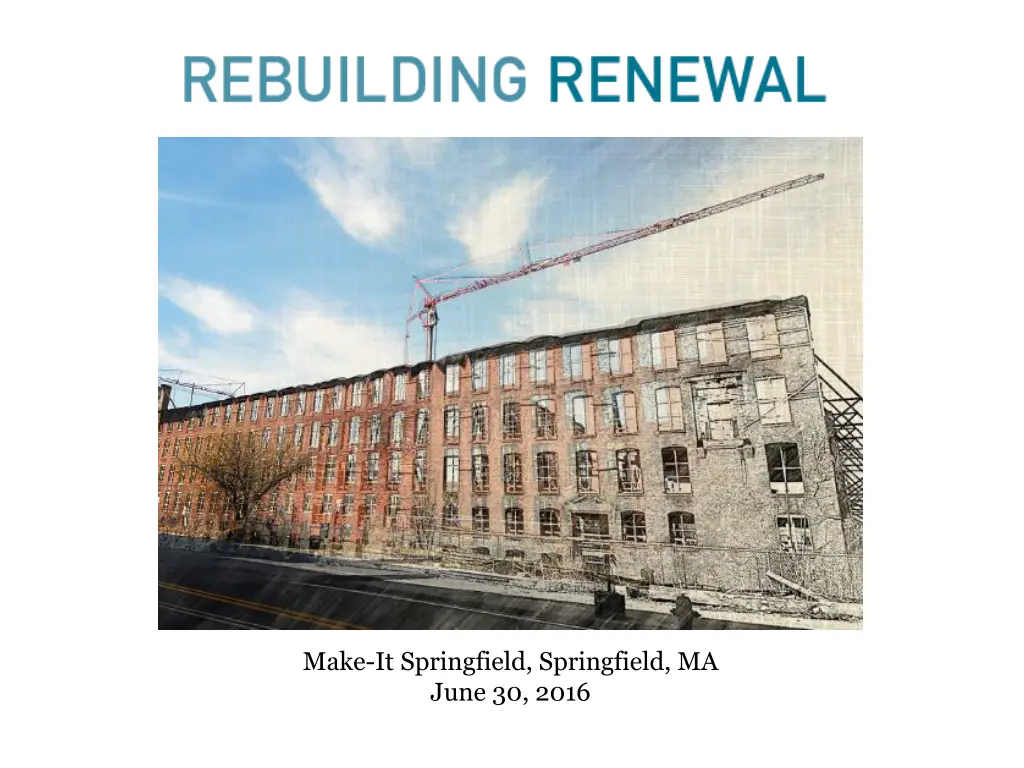
Make-It Springfield, Springfield, MA June 30, 2016
Rebuilding Renewal AN ANALYSIS OF STATE INVESTMENT IN GATEWAY CITIES AND DELIVERING TRANSFORMATIVE DEVELOPMENT
Todays Presentation New Gateway City Research State investment from FY 2009-2013 Gateway City shares by category Real estate development trends Gateway Cities falling further behind during economic recovery Case studies of catalytic investment and policy context Three ideas to help deliver transformative development
STATE INVESTMENT ANALYSIS FY09-FY13
FY 09 to FY13, Massachusetts invested $3.3 billion in Gateway Cities; nearly half went to educational facilities $6 $5.3 $5 $4 $3 $2 $1.1 $1 $0.6 $0.6 $1.7 $0.5 $0.3 $0.2 $0.8 $0.3 $0.2 $0.2 $- Education Miscellaneous Housing Economic Development Transportation Energy & Enivronment
FY 09 to FY13, Gateway Cities received 39% of state total 45% 40% 35% 30% 25% 20% 15% 10% 5% 0% Population Household Income People in Poverty State Investment
Most of this investment in educational facilities went to K-12 schools
MassWorks accounted for more than half of the states economic development investment in Gateway Cities $200 $181 $180 $160 $140 $120 $107 $104 $92 $100 $74 $80 $60 $99 $40 $31 $20 $33 $30 $19 $2 $8 $0 MassWorks EDIP Life Sciences Tax Credit Historic Credit Cultural Facilities Fund Other State Capital Plan
Historic tax credits provided the most important resource for housing development in Gateway Cities $200 $175 $174 $180 $160 $140 $120 $100 $75 $80 $60 $60 $91 $40 $25 $61 $20 $37 $30 $1 $13 $0 Historic Credit Affordable Housing Trust Fund Housing Stabilization Fund State LIHTC Capital Improvement Fund HDIP
Massachusetts invested more in court houses than in housing or economic development between FY 09 & 13 few large-scale investments for transformative development $300 $282 $262 $250 $210 $200 $150 $100 $50 $- Courts Housing Economic Development
GATEWAY CITY REAL ESTATE MARKET TRENDS
Comparing Pioneer Valley Gateway Cities to State Holyoke and Springfield have much lower household incomes and much higher poverty rates, compared to state and all Gateway Cities Holyoke and Springfield are economic centers with jobs but many workers live in surrounding towns Chicopee and Westfield have lower poverty rates but still have challenges and lower income than state average Jobs/Pop RatioMedian Household Gateway Cities Population Employment People in Poverty Poverty Rate Income Chicopee Holyoke Springfield Westfield Gateway Cities Massachusetts 55,795 40,124 153,991 41,608 1,705,443 6,745,408 18,874 22,009 78,625 18,490 696,088 3,363,035 0.34 0.55 0.51 0.44 0.41 0.50 $47,276 $35,550 $34,731 $60,845 $47,842 $67,846 12.7% 29.3% 28.9% 10.0% 18.6% 11.0%
Gateway City real estate markets are underperforming their share of the state population; Boston is dramatically over-performing
Since 2000, Boston has added $11 billion more in new growth to its tax rolls than Gateway Cities
Growth Index for Assessed Property Values 2000-2015 Holyoke and Springfield trail MA, Boston and Worcester 3 2.8 2.6 2.4 2.2 2 1.8 1.6 1.4 1.2 1 2000 2001 2002 2003 2004 2005 2006 2007 2008 2009 2010 2011 2012 2013 2014 2015 MA Boston Holyoke Springfield Worcester
Building permits in Gateway Cities exceeded Boston every year from 2000 to 2011 (except 2006) dramatically different story over last few years
Building permits in Holyoke and Springfield trail Worcester and Boston; are well-below pre-recession levels 700 3,000 600 2,500 500 2,000 400 1,500 300 1,000 200 500 100 0 0 2000 2001 2002 2003 2004 2005 2006 2007 2008 2009 2010 2011 2012 2013 2014 Holyoke Springfield Worcester Boston
The market gap makes it financially unfeasible to build or redevelop in Gateway Cities
Some examples of catalytic investments Gateway Cities Lowell, MA Hamilton Canal District Worcester, MA CitySquare Each major project had a number of common elements to achieve success: Sustained vision and commitment of public, non-profit and private leaders Public investment (e.g., MassWorks) to help with infrastructure, roads, environmental remediation Mix of anchor tenants (hospitals, insurance, UMass) and attracting small-medium sized diverse businesses Connection/integration to downtown and commuter rail
Some examples of catalytic investments New York State Buffalo Billion - $1 billion on economic revitalization guided by development strategies and target industries New York Upstate Revitalization Initiative (URI) - $1.5 billion to 3 regions Goals of the URI: Significant increase in permanent private sector jobs paying above average wages Widespread increase in household wealth Leverage public investment with 5 to 1 private investment Competitive application process based on strategies NY used financial settlement funds intentional choice to use those funds for upstate NY revitalization
Delivering Transformative Development Identify revenues to increase the level of investment in transformative development Baker Administration economic development expands funding in TDI, brownfields, MassWorks, land assembly, etc. Given MA fiscal realities, further increases will be difficult but some options worth exploring if we want to move the needle Better align investments with targeted redevelopment strategies Use project selection criteria such as location in TDI District and will the project attract follow-on private investment Creative/innovative higher education investments Increase transparency and accountability Create system/methods to track and evaluate state investments


