Investment and Financing Aspect of Small Hydropower Projects
This presentation by Narayan Poudel, a CA and Financial Analyst, covers the current investment status, financial scenarios, feasibility, revenue generation, expenses, and loan repayment plan of small hydropower projects. It includes data on project capacities, investment requirements, expected revenues, and real cash flow situations for various categories of projects.
Download Presentation

Please find below an Image/Link to download the presentation.
The content on the website is provided AS IS for your information and personal use only. It may not be sold, licensed, or shared on other websites without obtaining consent from the author.If you encounter any issues during the download, it is possible that the publisher has removed the file from their server.
You are allowed to download the files provided on this website for personal or commercial use, subject to the condition that they are used lawfully. All files are the property of their respective owners.
The content on the website is provided AS IS for your information and personal use only. It may not be sold, licensed, or shared on other websites without obtaining consent from the author.
E N D
Presentation Transcript
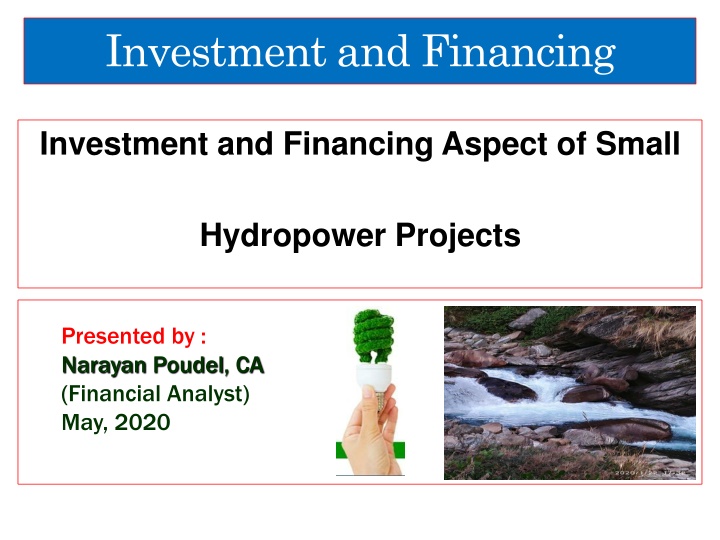
Investment and Financing Investment and Financing Aspect of Small Hydropower Projects Presented by : Narayan Poudel, CA (Financial Analyst) May, 2020
Contents Status of Small Hydropower Category of Small hydropower Projects ( Under Survey- GL Operation) Current Investment status ( Loan, Equity ) Financial Scenario Real cash flow and financial Situation Real financing Whether Small hydro is financially feasible or not? Based on Cash flow. Benefit from small hydropower Way forward and planning for sustain of small hydro.
Small Hydro Status Below 1 MW 1 to 3 MW 3-5 MW Total S.No Category Projects Capacity Projects CapacityProjectsCapacityProjects Capacity 1 Survey License Applied 1 0.67 0 0 3 12 4 12.67 3 Survey License Received 15 10.74 7 16.35 16 67.58 38 94.67 2 Generation License Applied 1 0.49 0 0 5 18.78 6 19.27 Generation License Received 4 25 19.63 42 59.69 35 158.84 102 238.16 5 Project Under Operation 15 11.24 41 143.59 56 154.83 Total 57 42.77 49 76.04 100 400.79 206 519.6
Investment Status Invetment Study Cost Bank Loan Total Invetment Plan Total Invest Req S.N o Category Project s Capacit y Per MW Per MW Total Loan Equity Total 1 Survey License Applied 4 12.67 1 20 253 0.10 1.27 - Survey License Received 2 38 94.67 19 20 1,893 0.20 18.93 - Generation License Applied 3 6 19.27 10 20 385 0.50 9.64 - Generation License Received 4 102 238.16 238 20 4,763 1.00 238.16 - Project Under Operation 5 56 154.83 1,022 22.00 3,406.26 2,384 Total 206 519.6 23.80 3674.26 1,290 7,295 2,384 5,107
Investment in Project Under Operation Capacity Expected revenue Revenue (Real ) Loss Per Year S.No Category Expected Capacity Per MW Total Per MW Total Project Under Operation 56 154.83 2.50 387.1 1.750 271 0.75 116 Total 56 154.83 2.50 387.1 2 271
Real Cash flow Below 1 MW 100% 20 70% 14 30% 6 Per Mw Investment Loan Equity Generation Scenarios Revenue - Per Year Expenses Total Royalty Operation Cost/ Admin Insurance General Repair Total Expenses Crore Crore Crore Below 1 MW 100% 80% 75% 70% A 2.75 2.20 2.06 1.93 1 2 4 5 B 0 0 0 0 0 Rs Fixed 0.4 0.06 0.4 0.06 0.4 0.06 0.4 0.06 0.4 0.06 Rs 6 lakh Per MW Rs 1.5 Lakh / Month 0.20 0.66 0.20 0.66 0.20 0.66 0.20 0.66 0.20 0.66 C D Surplus Bank Service Loan Loan Repay- Qtry ( 12 Yrs ) Interest rate 2.09 1.54 1.40 1.27 14 12 Years 8% 9% 10% 11% 12% 13% 8% 9% 10% 11% 12% 13% Installment 1.83 1.92 2.02 2.12 2.22 2.32 -0.29 -0.38 -0.48 -0.58 -0.68 -0.78 1.83 1.92 2.02 2.12 2.22 2.32 0.26 0.17 0.07 -0.03 -0.13 -0.23 1.83 1.92 2.02 2.12 2.22 2.32 -0.42 -0.52 -0.61 -0.71 -0.81 -0.92 1.83 1.92 2.02 2.12 2.22 2.32 -0.56 -0.65 -0.75 -0.85 -0.95 -1.05 Short fall
Real Cash flow Below 1-5 MW 100% 20 70% 14 30% 6 Per Mw Investment Loan Equity Generation Scenerios Revenue - Per Year Expenses Fixed Royalty Revenue Royalty Total Royalty Operation Cost/ Admin Insurance General Repair Total Expenses Surplus Bank Service Loan Loan Repayment Period Crore Crore Crore Range 1 MW to 5 MW 100% 80% 70% 60% A 3.00 2.40 2.10 1.80 1 Rs Rs Rs 100 /KW 2% of Rev 0.01 0.06 0.07 0.4 0.06 0.18 0.01 0.06 0.07 0.4 0.06 0.18 0.01 0.048 0.058 0.4 0.06 0.18 0.01 0.042 0.052 0.4 0.06 0.18 0.01 0.036 0.046 0.4 0.06 0.18 2 4 5 B C D Rs Fixed Rs 6 lakh Per MW Rs 1.5 Lakh / Month 0.71 0.71 2.29 0.70 1.70 0.69 1.41 0.69 1.11 14 12 Years- Qtrly 8% 9% 10% 11% 12% 13% 8% 9% 10% 11% 12% 13% Installment ( Yearly) 1.83 1.92 2.02 2.12 2.22 2.32 -0.12 -0.22 -0.31 -0.41 -0.51 0.62 1.83 1.92 2.02 2.12 2.22 2.32 0.46 0.37 0.27 0.17 0.07 0.03 1.83 1.92 2.02 2.12 2.22 2.32 -0.42 -0.51 -0.61 -0.71 -0.81 0.91 1.83 1.92 2.02 2.12 2.22 2.32 -0.71 -0.81 -0.90 -1.00 -1.10 1.21 Interest rate Short fall
Real Cash flow Below 5-10 MW Per Mw Investment Loan Equity Generation Scenarios Revenue - Per Year Expenses Fixed Royalty Revenue Royalty Total Royalty Operation Cost/ Admin Insurance General Repair Total Expenses Surplus Bank Service Loan Loan Repayment Period 100% 70% 30% 19 13.3 5.7 Crore Crore Crore Range 5 MW to 10 MW 100% 80% 70% 60% A 3.00 2.40 2.10 1.80 1 Rs Rs Rs 100 /KW 2% of Rev 0.01 0.06 0.07 0.4 0.05 0.15 0.01 0.06 0.07 0.4 0.05 0.15 0.01 0.048 0.058 0.4 0.05 0.15 0.01 0.042 0.052 0.4 0.05 0.15 0.01 0.036 0.046 0.4 0.05 0.15 2 4 5 B C D Rs Fixed Rs 5 lakh Per MW Rs 15 Lakh / year 0.67 0.67 2.33 0.66 1.74 0.65 1.45 0.65 1.15 13.3 12 Years ( Qtrly) 8% 9% 10% 11% 12% 13% 8% 9% 10% 11% 12% 13% Installment ( Yearly) 1.73 1.82 1.92 2.01 2.11 2.20 0.01 -0.08 -0.17 -0.27 -0.36 0.46 1.73 1.82 1.92 2.01 2.11 2.20 0.60 0.51 0.41 0.32 0.22 0.13 1.73 1.82 1.92 2.01 2.11 2.20 -0.29 -0.38 -0.47 -0.56 -0.66 0.76 1.73 1.82 1.92 2.01 2.11 2.20 -0.58 -0.67 -0.76 -0.86 -0.95 1.05 Interest rate Short fall
Benefit. 1.Learning by Doing from Small hydropower Project 2.Local employment 3.Tax / Vat / License fees Contribution to Government 4.Local distribution 5.Technology handover 6.Utilization of natural resources 7.Investment opportunities 8.Contribution to National grid and Local grid. 9.Below 1 MW license period for forever long period
Way forward / Solution for smooth operation For Under Operation Project 1. Formation/ Creation of Rehabilitation fund . 2. How it can be establish ? - Government contribution - Some amount from License fees - Collection of fund through under contraction project through the 1% or certain percentage of tax on payment to Supplier / contractor - Minimum Contribution from all hydropower projects 3. Contribution by Government - Tax Benefit till loan repayment Period - Local Government bodies Participation in equity investment - Payment of loan from rehabilitation fund if short fall of loan 4. From Bank - Loan repayment period to be reschedule minimum 15 years to 20 years - Interest rate should be single digit. - Provision of soft loan through NRB - No black list or No provision for watch list for next one year 5.From NEA - Posted rate to be given to all small hydropower Projects / Dry-Wet Ratio 1:1 (6/6 months) - Removable of provision of Short supply of Energy due to hydrology and line loss 6. From Equity holder - No dividend till regulation of loan
Way forward / Solution for smooth operation For Under study and Under process of Construction Project 1. Formation/ Creation of Rehabilitation fund 2. How it can be establish ? - Government contribution - Some amount from License fees - Collection of fund through under contraction project through the 1% or certain percentage of tax on payment to Supplier / contractor - Minimum Contribution from all hydropower projects 3. Contribution by Government - Tax Benefit till loan repayment Period - Local Government bodies Participation in equity investment 4. From Bank - Minimum investment should be less than 5 or 10 MW Projects ( Minimum 5 Projects and minimum 5 Arab or any amount . - Interest rate should be single digit 5.From NEA - No Penalty for less generation 6. From Equity holder - Minimum investment plan
Conclusion 1 For Financial Viability a. Cost Should be less than 6 times of Revenue for Viability b.If Cost equal to more than 6- and in between 6-to 7 time of Revenue then Project is marginal c.If cost is more than 7 Time it may not be feasibility 2. For Further development and rehabilitation of Project a. Creation of Fund for project rehabilitation b.Proper decision for responsibility of all stake holders ( Equity holder, Bank, Government , NEA and Local Government ) c. Project should be proper study before implementation and more the investment in study more reliability
