Irrigating Corn for Climate Change Adaptation Research
Explore the PIAMDDI Project Meeting at Stanford University discussing the impact of irrigation on corn production to adapt to climate change. Dive into the implications of climate-energy policy interactions, the potential impact of irrigation on yield, yield variability, and USDA-NASS data analysis in Nebraska. Discover how incorporating irrigation into the standard model framework affects previous results in a simplified climate change context.

Download Presentation

Please find below an Image/Link to download the presentation.
The content on the website is provided AS IS for your information and personal use only. It may not be sold, licensed, or shared on other websites without obtaining consent from the author. If you encounter any issues during the download, it is possible that the publisher has removed the file from their server.
You are allowed to download the files provided on this website for personal or commercial use, subject to the condition that they are used lawfully. All files are the property of their respective owners.
The content on the website is provided AS IS for your information and personal use only. It may not be sold, licensed, or shared on other websites without obtaining consent from the author.
E N D
Presentation Transcript
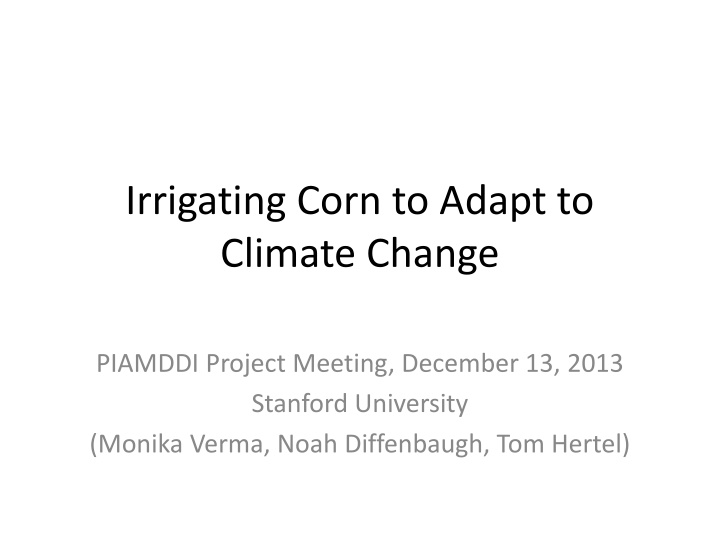
Irrigating Corn to Adapt to Climate Change PIAMDDI Project Meeting, December 13, 2013 Stanford University (Monika Verma, Noah Diffenbaugh, Tom Hertel)
Climate-Energy-Policy Interaction What we missed was Adaptation: How can policy on bio-fuels affect it? Trade? 1
Recap What about irrigation as adaptation? Corn price Standard Deviation quadruples due to doubled SD of US corn yields, driven by Climate change 2
Irrigations Potential Impact How irrigation affects yield (model input, US yield SD) ????,?= ??????? S&R: effect of temperature much different in East and West, major difference - irrigation Source: Schlenker and Roberts, PNAS 2009, Fig A10 3
Yield Variability as input Same functional form Irrigated and non-irrigated corn production shares in county s corn production 4
USDA-NASS data for Nebraska irrigated and non-irrigated corn yield/production county data (1990-2012) Construct the same metric for Nebraska Yield SD for irrigated corn: 0.12 Yield SD for non-irrigated corn: 0.34 (~ 3 times) Yield SD: 0.15 5
Question, what our previous graphs would look like with irrigation. Focus on simple case, leave out policy and oil price scenarios, concentrating on just climate change + + irrigation How do we bring in irrigation into our standard model framework, for comparison with earlier results? 6
????= ?????????+ ??????? ? ???? ???? = ?????? ??? + ??? ? what we had with our no-irrigation story Know its present climate SD Know that it doubles with climate change A more generic version, including irrigation 7
Implications Case 1: No Irrigation (??= 0,??= 1) ????= ?????? ? Same as NCC work form, with no irrigation 8
Case 2: Full Irrigation (??= 1,??= 0) ???? ???? ????= ?????? ? Simplifying assumptions in absence of data NE data applies to all counties/states UNL study to approximate ? ?? . ???? Cassssman 2009) ? ?? ? ?? = 0.32 ???? ????= 0.42 < 1 implies ? ?? . ???? =???? ???? (Grassini, Yang, ???? ???? =0.30 0.34 and 0.67 year on year yield ratios for fully irrigated crop are less than those for non-irrigated crop, hence pointing to potential of irrigation as adaptation SD with irrigation = 0.42*SD without irrigation 9
Case 3: Partial irrigation (??= ?,??= 1 ?) 1 ??? 1 ???? ????= ?????? ???? ? 0<(.)<1 0<(.)<1 SD is decreasing in share of production under irrigation ????? ???? ? Rebased SD (US yield) + (? ?) Case1: no irrig 1 1.09 23.89 Case3(Base for 2001): 0.14 0.92 1 21.92 Case2: full irrig 0.42 0.46 10.03 10
120 100 X: corn yield SD Y: corn price SD NCC+14R 80 NCC+100R 60 40 20 0 -40 -30 -20 -10 0 10 20 30 40 -20 -40 -60 120 100 NCC+14R 80 Vertical distance: difference in price SD coming from irrigation NCC+100R 60 40 20 0 Y: corn price SD Two points on same vertical line represent same climate realization -20 -40 12 -60
600 400 350 500 300 400 250 CC+14R CC2+14R 200 300 150 CC+100R CC2+100R 200 100 50 100 0 0 -80 -60 -40 -20 0 20 40 60 80 -50 -80 -60 -40 -20 0 20 40 60 80 -100 -100 600 400 350 500 300 400 250 CC+14R CC2+14R 200 300 150 CC+100R 200 CC2+100R 100 100 50 0 0 -50 -100 -100 13
Price and Yield SD under different climate and irrigation combinations 200 44 180 14R 100R 160 39 140 120 Corn Price SD 100 80 22 20 60 10 40 4 20 0 NCC CC CC2 Climate Scenario Height of Bar indicates Price SD and number next to bar is the yield SD 14
Strange result (with irrigation even after climate change we get less variability than under same irrigation % and no climate change) Other study: one from Swiss corn (Finger et al 2011, ClimChng) Bring in more economics: even if irrigation is effective, under what conditions would it be feasible/viable to use One approach would be to take multiple corn price realizations for future and see if its profitable for farmers to use surface, ground water to irrigate Cost of irrigation, infrastructure. Collaborate with actual working water model and see if these insights hold, magnitude of impact would likely change 15


")
")