Learn about the ISTAR standard setting methodology involving ID matching, panelist judgments, threshold regions, and cut scores. Explore the meeting and logistics details, including the assessment process, panelist discussions, and practice rounds. Experience the rigorous evaluation process designed to determine proficiency levels in education.
Please find below an Image/Link to download the presentation.
The content on the website is provided AS IS for your information and personal use only. It may not be sold, licensed, or shared on other websites without obtaining consent from the author. If you encounter any issues during the download, it is possible that the publisher has removed the file from their server.
You are allowed to download the files provided on this website for personal or commercial use, subject to the condition that they are used lawfully. All files are the property of their respective owners.
The content on the website is provided AS IS for your information and personal use only. It may not be sold, licensed, or shared on other websites without obtaining consent from the author.
Overview of ISTAR Standard Setting Methodology Item Descriptor (ID) Matching was suggested by the Indiana TAC for finding cut scores on the ISTAR tests. ID matching process: Evaluative process using an Ordered Item Booklet (OIB) and Performance Level Descriptors (PLDs) over several rounds Based on the Performance Level Descriptors, panelists made judgments about each of the items in the OIB, classifying it as Developing, Meeting, or Exceeding proficiency (Rounds 1 and 2) Panelists then indicated a threshold region where the item descriptors change from mostly lower PLD to mostly higher PLD (Rounds 1 and 2) Within the threshold region, panelists are asked to find a transition point in the OIB where knowledge, skills, and cognitive processes required by items change from the lower PLD and begin to match more closely the knowledge, skills, and cognitive processes described in the higher level PLD (Rounds 3 and 4)
ISTAR Standard Setting Meeting and Logistics: General session overview of ISTAR, introduction to the process, meeting logistics, housekeeping, security protocols Experience the assessment panelists utilized the testing environment mirroring the student experience and interaction with items PLD discussion panelists reviewed and discussed the PLDs for the upper grade what knowledge, skills, and cognitive processes expected of students classified in each performance level OIB discussion panelists reviewed and discussed the OIB for the upper grade what knowledge, skills, and cognitive processes are required to answer it correctly, and why is each item more difficult than the previous ones in the OIB ID Matching practice round panelists were assigned sample (10) items from the OIB to practice the tasks of matching items to PLDs
ISTAR Standard Setting Meeting and Logistics (cont.) Rounds of judgments and feedback 4 rounds of judgments (assign every item in the OIB to a PLD, identify threshold regions, and locate a cut score within each threshold region) After each round, facilitator provided panelists with data that they can use to evaluate and inform their judgments in the subsequent rounds. Feedback data varied by round but generally included summary statistics (i.e., descriptive statistics, such as the mean, median, minimum, and maximum page numbers) for the threshold region boundaries and recommended cut scores, agreement data, and impact data. Repeat process with the lower grade-level assessment Table Leaders continued to the Vertical Articulation meeting Panelists examined the reasonableness of the proposed cut score recommendations across the grade levels
ISTAR Standard Setting Logistics Standard Setting Meetings: June 19 21: ELA and Science June 26 28: Mathematics and Social Studies Panels consisted of multiple breakouts: Four grade band panels (3 4, 5 6, 7 8 and 10) ELA and Mathematics Two grade band panels (4 and 6, and 10) Science One grade band panel (5 and 7) Social Studies Each grade band panel had a facilitator and a content specialist Each panel consisted of 8 9 Indiana Educators in two tables; most panels had one general education teacher Two of the panelists were designated by IDOE as table leaders they led table discussions, took notes, and spoke on behalf of the table during the large-group discussion
ISTAR ELA Reconvening Questar identified an issue in early July with the impact data presented to the ISTAR ELA panelists. TAC recommended a cut score validation to ensure the recommendations made by the panelists during the June meeting reflected a valid process. A subset of panelists reconvened on August 7, 2017 to consider judgments for Round 4 and vertical articulation with accurate data confirmed by a third party vendor.
ISTAR Performance Levels Two cuts were recommended for each grade and subject: The Meeting Proficiency cut The cut score that differentiates Developing Proficiency performance from Meeting Proficiency performance. The Exceeding Proficiency cut The cut score that differentiates Meeting Proficiency performance from Exceeding Proficiency performance.
ISTAR Standard Setting Results Tables and graphs in the coming slides present the impacts of cut scores Multiple impacts are given for all grades and content areas Impacts of cuts recommended in Round 4 by grade band panels Impacts of cuts adjusted in vertical articulation committees, if adjustments were made Impact of IDOE recommendation for ELA and Mathematics Impacts of cuts on the whole population which includes the No Mode of Communication students reported as Undetermined proficiency level
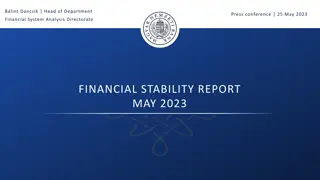
ISTAR Standard Setting Results ELA, All Students Impact Data for ISTAR ELA after Vertical Articulation, NMC Students Included 100 11 19 20 90 24 24 25 35 16 80 70 26 26 35 29 60 45 50 35 64 40 30 43 43 40 41 31 20 26 10 9 7 7 6 5 4 4 0 Grade 3 Grade 4 Grade 5 Grade 6 Grade 7 Grade 8 Grade 10 Percentage of Students No Mode of Communication Developing Proficiency Meeting Proficiency Exceeding Proficiency
Possible adjustments to ELA cuts Grade 3 Currently the meeting proficiency cut is set on item 10 of the OIB, resulting in 70% of students classified as developing proficiency. Vertical articulation panel would support moving the cut to item 7, as they thought items 7, 8, and 9 were also better aligned to meeting proficiency than developing proficiency. Grade 6 Currently the meeting proficiency cut is set on item 8 of the OIB, resulting in 32% of students classified as developing proficiency. Moving to item 10 is within the threshold range of panelist ratings and creates better alignment with the other grade levels.
Possible adjustments to ELA cuts (cont.) Grade 10 Currently the exceeding proficiency cut is set on item 34 of the OIB, resulting in 36% of students classified as exceeding proficiency. Vertical articulation panel said they could support moving the cut to item 37, as it was the point where items clearly transitioned from meeting proficiency to exceeding proficiency.
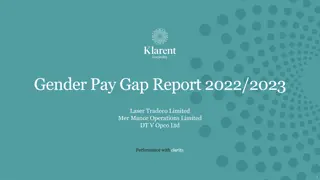
ISTAR Standard Setting Results ELA, all students, Grade 3, 6, 10 adjusted Impact Data for ISTAR ELA, NMC Students Included, Grades 3,6,10 adjusted 100 11 19 20 90 24 24 25 35 16 80 70 26 26 35 29 60 45 50 35 64 40 30 43 43 40 41 31 20 26 10 9 7 7 6 5 4 4 0 Grade 3 Grade 4 Grade 5 Grade 6 Grade 7 Grade 8 Grade 10 Percentage of Students No Mode of Communication Developing Proficiency Meeting Proficiency Exceeding Proficiency
ELA: Context for Results Specifically, the Vertical Articulation panel had the following thoughts about grade 3 impact data: PLDs and the associated assessment were seen as being more difficult in this grade than in other grades Grade 3 is the first year the students take the assessment, so they might be struggling with the concept of test-taking
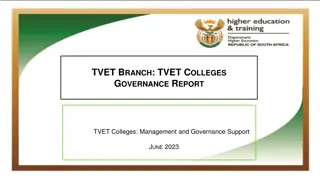
ISTAR Standard Setting Results Math, All Students Impact Data for ISTAR Math, NMC Students Included 100 3 4 5 6 9 11 12 10 90 23 23 29 80 19 36 29 70 60 50 82 68 40 62 61 60 51 55 30 20 10 9 7 7 6 5 4 4 0 Grade 3 Grade 4 Grade 5 Grade 6 Grade 7 Grade 8 Grade 10 Percentage of Students No Mode of Communication Developing Proficiency Meeting Proficiency Exceeding Proficiency
Possible adjustments to Grade 7 cut Currently the meeting proficiency cut is set on item 12 of the OIB, resulting in 85% of students classified as developing proficiency. In order to better articulate the impact data for Grade 7, IDOE recommended item 6 of the OIB be used for the Grade 7 meeting proficiency cut. Item 6 was identified during Round 2 of the process.
ISTAR Standard Setting Results Math, all students, Grade 7 cut adjusted Impact data for ISTAR Math Grade 7, NMC Students Included; Grade 7 adjusted (p.6) 100 3 4 5 6 9 11 12 90 23 23 23 29 80 19 36 29 70 60 50 68 40 69 62 61 60 51 55 30 20 10 9 7 7 6 5 4 4 0 Grade 3 Grade 4 Grade 5 Grade 6 Grade 7 Grade 8 Grade 10 Percentage of Students No Mode of Communication Developing Proficiency Meeting Proficiency Exceeding Proficiency
Mathematics: Context for Results Grade 7 has been identified as being naturally harder than other grades in mathematics by the vertical articulation panel for the following reasons: The PLDs, even at the developing level require more complex functioning of students than the PLDs from other grades ( understand and predict vs. identify ). The content is different, calling for more abstract mathematical thinking (square roots and rational/irrational numbers). Students are asked to use prior knowledge to apply their skills. They may or may not have this prior knowledge. Grade 3 has been identified by the Vertical Articulation panel as possibly being easier for the students than other grades for, among others, the following reasons: There are fewer components in Content Connectors. Content is more concrete and applicable to everyday life and therefore more familiar to students.
ISTAR Standard Setting Results Social Studies, Round 4 Impact Data for ISTAR Social Studies after Round 4 100 20 21 90 80 70 34 60 48 50 40 30 44 20 32 10 0 Grade 5 Grade 7 Developing Proficiency Meeting Proficiency Exceeding Proficiency
ISTAR Standard Setting Results Social Studies, Vertical Articulation Impact Data for ISTAR Social Studies after Vertical Articulation 100 20 21 90 80 70 34 60 48 50 40 30 44 20 32 10 0 Grade 5 Grade 7 Developing Proficiency Meeting Proficiency Exceeding Proficiency
ISTAR Standard Setting Results Social Studies, All Students Impact Data for ISTAR Social Studies, NMC Students Included 100 18 20 90 80 70 33 45 60 50 40 30 43 30 20 10 7 4 0 Grade 5 Grade 7 Percentage of Students No Mode of Communication Developing Proficiency Meeting Proficiency Exceeding Proficiency


")