IUPUI Climate Survey 2014 Participant Characteristics Analysis
Explore the participant characteristics of the IUPUI Climate Survey 2014, including demographics such as gender, race/ethnicity, religion, political ideology, and campus environment perceptions among undergraduate students, graduate students, faculty, and staff. Gain insights into the diverse experiences and perspectives within the IUPUI campus community.
Download Presentation

Please find below an Image/Link to download the presentation.
The content on the website is provided AS IS for your information and personal use only. It may not be sold, licensed, or shared on other websites without obtaining consent from the author. If you encounter any issues during the download, it is possible that the publisher has removed the file from their server.
You are allowed to download the files provided on this website for personal or commercial use, subject to the condition that they are used lawfully. All files are the property of their respective owners.
The content on the website is provided AS IS for your information and personal use only. It may not be sold, licensed, or shared on other websites without obtaining consent from the author.
E N D
Presentation Transcript
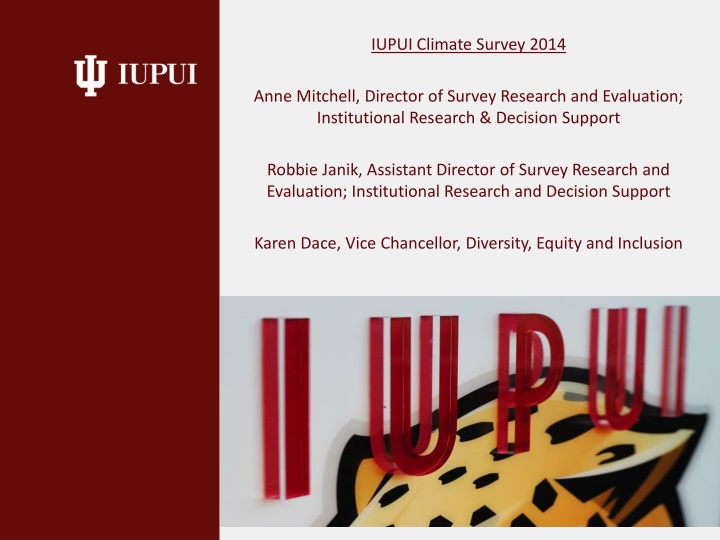
IUPUI Climate Survey 2014 Anne Mitchell, Director of Survey Research and Evaluation; Institutional Research & Decision Support Robbie Janik, Assistant Director of Survey Research and Evaluation; Institutional Research and Decision Support Karen Dace, Vice Chancellor, Diversity, Equity and Inclusion
Methodology Purpose: to measure campus climate indicators in order to better understand faculty, staff, and students experiences on the IUPUI campus / expand definition of diversity Invitations sent to every Full-time faculty member Full-time staff member Student enrolled in Fall 2014 I N D I A N A U N I V E R S I T Y P U R D U E U N I V E R S I T Y 1 I N D I A N A P O L I S
Participant Characteristics Undergraduate Students Graduate Students 41% 59% 59% 6% 5% 21% 9% 10% 90% 4% 96% 48% 19% 34% 17% 39% 44% 972 16% Staff Faculty 52% 48% 71% 6% 5% 13% 5% 8% 92% 4% 96% 51% 11% 38% 14% 33% 53% 1052 33% 28% 72% 78% 11% 4% 2% 5% 8% 92% 5% 95% 72% 4% 24% 25% 41% 34% 1832 44% 37% 63% 72% 9% 7% 5% 7% 14% 86% 5% 95% 61% 7% 33% 25% 45% 30% 2535 12% Men Women White Black Latino Asian Other LGBTQ+ Non-LGBTQ+ With Disability No Disability Christian Non-Christian Religious No Religious Affiliation Conservative Moderate Liberal n Response rate I N D I A N A U N I V E R S I T Y P U R D U E U N I V E R S I T Y 2 I N D I A N A P O L I S
Asking Demographics Gender: binary (woman/man) Do you consider yourself to be transgender or gender non- conforming? Sexual orientation: Gay, lesbian, bisexual, heterosexual, queer/pansexual/something else Race/ethnicity: Check all that apply Black, Latino, American Indian/Alaskan Native, Asian, Middle Eastern, Native Hawaiian/Pacific Islander, Other Specify Religion: Number of religions listed, if Christian checked opened up to specific Christian denominations Political ideology: Very liberal to Very conservative scale I N D I A N A U N I V E R S I T Y P U R D U E U N I V E R S I T Y 3 I N D I A N A P O L I S
Overall Campus Environment Undergraduate Students 95% Graduate Students 94% Faculty 81% Staff 82% Percentage who agree with I feel free to be myself at IUPUI At IUPUI I sometimes fear speaking up for what I think I feel safe on campus There are a lot of people like me on campus IUPUI has a commitment to diversity IUPUI places too much emphasis on diversity IUPUI has diverse faculty and staff 39% 40% 27% 25% 90% 74% 90% 23% 68% 84% 79% 22% 91% 80%*** 93%** 29%*** 82%*** 93%*** 85%*** 22% 85% 72% 83% 73% 96% 92%*** 28% 90% 24%* 83%*** 96% 90%*** IUPUI has a diverse student population IUPUI accurately reflects diversity in publications 89% 84%*** 13% 13% IUPUI has a lot of tension around diversity issues 1052 1832 2532 972 N ***p<.001; **p<.01; *p<.05 I N D I A N A U N I V E R S I T Y P U R D U E U N I V E R S I T Y 4 I N D I A N A P O L I S
Campus Environment Campus environment indicators differ by group Patterns hold for faculty/staff and students although the these differences are less pronounced for students Intersecting statuses I N D I A N A U N I V E R S I T Y P U R D U E U N I V E R S I T Y 5 I N D I A N A P O L I S
Overall Campus Environment White Women Faculty Black Women Faculty Other Women Faculty Latina Faculty Percentage who agree with 81% 67% 92% 84% I feel free to be myself at IUPUI 45% 43% 50% 40% At IUPUI I sometimes fear speaking up for what I think 84% 80% 88% 90% I feel safe on campus 77% 20% 67% 81% There are a lot of people like me on campus 92% 61% 83% 84% IUPUI has a commitment to diversity 17% 7% 8% 18% IUPUI places too much emphasis on diversity 62% 28% 58% 60% IUPUI has diverse faculty and staff 83% 63% 71% 83% IUPUI has a diverse student population 76% 57% 74% 73% IUPUI accurately reflects diversity in publications 22% 43% 38% 27% IUPUI has a lot of tension around diversity issues 54% 59% 63% 56% It s difficult to move up in my career 339 30 24 57 N I N D I A N A U N I V E R S I T Y P U R D U E U N I V E R S I T Y 6 I N D I A N A P O L I S
Bias/Harassment/Discrimination Faculty / Staff 37% of women faculty (20% of women staff) 29% of faculty/staff of color (44% of black faculty/staff) 29% of LGBTQ+ faculty/staff 30% of faculty/staff reporting a disability Students 13% of women 18% of students of color 16% of sexual minorities / 29% transgender students 23% of students reporting a disability I N D I A N A U N I V E R S I T Y P U R D U E U N I V E R S I T Y 7 I N D I A N A P O L I S
Bias/Harassment/Discrimination If you experienced bias/harassment/ discrimination, please describe one incident without using names. 1,634 total responses Bias/Harassment/Discrimination differs based on statuses Verbal comments are the most common means in which individuals experience bias regardless of status I N D I A N A U N I V E R S I T Y P U R D U E U N I V E R S I T Y 8 I N D I A N A P O L I S
Bias/Harassment/Discrimination Gender Sexual/street harassment Assumptions regarding women s roles Race/ethnicity Assumptions regarding quality of work Access and representation Sexual orientation / Gender identity Name-calling / Jokes / Misgendering Backlash regarding inclusion Ability Status Attitudes toward accessing services Religion, Politics, Age, Citizenship, Language I N D I A N A U N I V E R S I T Y P U R D U E U N I V E R S I T Y 9 I N D I A N A P O L I S
Conclusion s Overall, IUPUI faculty, staff, and students rate the campus environment positively They feel safe, feel free to be themselves, and agree that IUPUI has a commitment to diversity. Campus environment differs across groups Understanding climate is difficult at an institutional level I N D I A N A U N I V E R S I T Y P U R D U E U N I V E R S I T Y 10 I N D I A N A P O L I S
Steps taken Series of meetings with decision makers Deans, Vice Chancellors, HR, Faculty Development, Affinity Group Leaders Provided resources that aligned with climate concerns and could be used for planning purposes Climate Survey data use Diversity Plans Townhalls on Diversity Concerns Programming out of Faculty/Staff councils and various offices LGBTQ+ Center creation I N D I A N A U N I V E R S I T Y P U R D U E U N I V E R S I T Y 11 I N D I A N A P O L I S
Contact Information: Anne Mitchell: amitch29@iupui.edu Robbie Janik: rjanikii@iupui.edu Vice Chancellor Karen Dace: kdace@iupui.edu IRDS Website: Campus Climate I N D I A N A U N I V E R S I T Y P U R D U E U N I V E R S I T Y 12 I N D I A N A P O L I S


