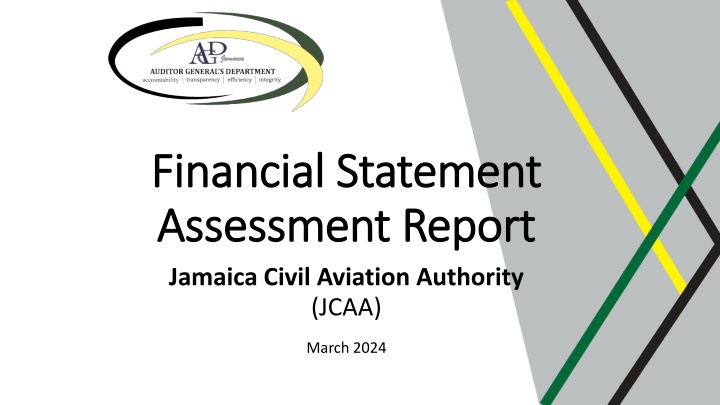
Jamaica Civil Aviation Authority Financial Assessment Report 2024
Explore the financial assessment report of Jamaica Civil Aviation Authority (JCAA) for the period up to March 2024, covering key aspects such as net profit fluctuation, liquidity levels, long-term debt analysis, and more. Get insights into JCAA's financial performance and trends through this detailed examination.
Uploaded on | 0 Views
Download Presentation

Please find below an Image/Link to download the presentation.
The content on the website is provided AS IS for your information and personal use only. It may not be sold, licensed, or shared on other websites without obtaining consent from the author. If you encounter any issues during the download, it is possible that the publisher has removed the file from their server.
You are allowed to download the files provided on this website for personal or commercial use, subject to the condition that they are used lawfully. All files are the property of their respective owners.
The content on the website is provided AS IS for your information and personal use only. It may not be sold, licensed, or shared on other websites without obtaining consent from the author.
E N D
Presentation Transcript
Financial Statement Financial Statement Assessment Report Assessment Report Jamaica Civil Aviation Authority (JCAA) March 2024
Background Background The AuGD did not audit JCAA s financial statements or test the Management s assertions regarding the figures in the financial statements and disclosures. The ratios were merely intended to provide trend analyses of key financial items in the financial statements. The analysis of the Jamaica Civil Aviation Authority (JCAA) financial statements was intended to assist Parliament and the PAC in their review of the entity s financial performance through .
JCAAs Mandate & Mission JCAA s Mandate & Mission Mandate: To provide aviation safety and security oversight, economic regulation of air transport and promote the development of air transport. including the establishment of training facilities for that purpose. Mission: To ensure the provision of a safe, reliable, efficient and user-friendly Air Transport System, consistent with the standards and recommended practices developed by the International Civil Aviation Organization (ICAO).
JCAAs Net Profit fluctuated but remained sound for the period JCAA Profitability JCAA Profitability JCAA s Net Profit Margin - FY2017/18 to FY2021/22 2,000,000.0 0.25 1,000,000.0 0.2 0.0 -1,000,000.0 J$'000 0.15 -2,000,000.0 0.1 -3,000,000.0 -4,000,000.0 0.05 -5,000,000.0 -6,000,000.0 0 FY2017/18 567,147.0 -3,547,394.0 0.12 FY2018/19 994,363.0 -3,217,062.0 0.2 FY2019/20 544,581.0 -3,816,711.0 0.11 FY2020/21 116,724.0 -5,201,660.0 0.02 FY2021/22 253,546.0 -4,257,000.0 0.05 Net Profit/Loss(inc. GOJ Subvention) Net Profit/Loss(Net of GOJ Subvention) Net Profit Margin(with GOJ Subvention)
JCAAs liquidity levels were adequate during the review period, as both the current and cash ratios met the established standards, averaging 4.8 and 1.81, respectively. JCAA s Liquidity JCAA s Liquidity Liquidity Ratios Financial Years 2017/18 to 2021/22 Financial Year 2021/22 2020/21 2019/20 2018/19 2017/18 Current Ratio 5.55 5.67 5.10 4.12 3.56 Quick Ratio 5.53 5.63 5.07 4.10 3.55 Cash Ratio 1.60 1.74 1.60 2.13 1.96
Minimal JCAAs Minimal JCAA s Long Long- -Term Debt Term Debt FY2021/22 FY2020/21 FY2019/20 FY2018/19 FY2017/18 JCAA s long-term debt to equity ratio averaged 0.09 for the five- year review period, well within the criteria of 2.5 established in the Fiscal Responsibility Framework Regulations. Item J$ '000 J$ '000 J$ '000 J$ '000 J$ '000 Total Assets 11,823,688.00 11,644,307.00 11,747,170.00 10,949,366.00 11,098,394.00 Total Liabilities 2,298,468.00 1,811,502.00 1,888,819.00 1,892,201.00 2,113,589.00 Equity 9,525,220.00 9,832,805.00 9,858,351.00 9,057,165.00 8,984,805.00 Payables 1,088,254.00 938,089.00 959,410.00 1,240,948.00 1,598,868.00 Debt to Assets 0.19 0.16 0.16 0.17 0.19 Debt to Equity 0.24 0.18 0.19 0.21 0.24
JCAAs Receivables JCAA s Receivables Turnover Turnover 7,000,000.0 8.00 7.00 6,000,000.0 6.00 5,000,000.0 5.00 The JCAA s receivables turnover ratio displayed an increasing trend over the five-year review period. 4,000,000.0 J$'000 Ratio 4.00 3,000,000.0 3.00 2,000,000.0 2.00 1,000,000.0 1.00 - 0.00 FY2017/18 5,467,349.8 898,528.5 6.08 FY2018/19 6,118,840.2 828,158.5 7.39 FY2019/20 6,208,932.4 822,986.5 7.54 FY2020/21 2,181,562.6 866,649.5 2.52 FY2021/22 5,710,418.1 928,201.0 6.15 Total Revenue Avg Account Receivables Receivables Turnover
JCAAs Working Capital JCAA s Working Capital 7,000,000.0 1.80 1.60 6,000,000.0 1.40 5,000,000.0 1.20 JCAA s working capital also displayed a positive trend over the period moving to a high of $5.0 billion in FY2021/22. 4,000,000.0 1.00 J$'000 0.80 3,000,000.0 0.60 2,000,000.0 0.40 1,000,000.0 0.20 - - FY2017/18 5,467,349.8 4,109,804.0 1.33 FY2018/19 6,118,840.2 3,871,202.0 1.58 FY2019/20 6,208,932.4 4,020,373.0 1.54 FY2020/21 2,181,562.6 4,407,909.0 0.49 FY2021/22 5,710,418.1 4,985,902.0 1.15 Total Collections Working Capital Working Capital Turnover Ratio
JCAAs Total Assets Turnover JCAA s Total Assets Turnover 7,000,000.0 1.20 6,000,000.0 1.00 5,000,000.0 0.80 JCAA s total asset turnover ratio fluctuated throughout the period as the ratio increased to 0.53 in FY2019/20 from 0.49 in FY2017/18 before reducing to 0.48 in FY2021/22. 4,000,000.0 J$ '000 0.60 3,000,000.0 0.40 2,000,000.0 0.20 1,000,000.0 - - FY2017/18 5,467,349.8 5,289,345.0 1.09 0.49 FY2018/19 6,118,840.2 5,747,020.0 1.11 0.56 FY2019/20 6,208,932.4 6,613,566.0 1.00 0.53 FY2020/21 2,181,562.6 6,155,932.0 0.34 0.19 FY2021/22 5,710,418.1 5,605,339.0 0.97 0.48 Total Collections Fixed Asset Fixed Asset Turnover Ratio Total Asset Turnover Ratio


