Jefferson County 2024 Flood Risk Assessment Details
Explore the 2024 flood risk assessment details for Jefferson County, including social vulnerabilities, critical infrastructure, building exposure, and more. Discover floodplain characteristics, cumulative risk index, and insights on building exposure in the area.

Download Presentation

Please find below an Image/Link to download the presentation.
The content on the website is provided AS IS for your information and personal use only. It may not be sold, licensed, or shared on other websites without obtaining consent from the author. If you encounter any issues during the download, it is possible that the publisher has removed the file from their server.
You are allowed to download the files provided on this website for personal or commercial use, subject to the condition that they are used lawfully. All files are the property of their respective owners.
The content on the website is provided AS IS for your information and personal use only. It may not be sold, licensed, or shared on other websites without obtaining consent from the author.
E N D
Presentation Transcript
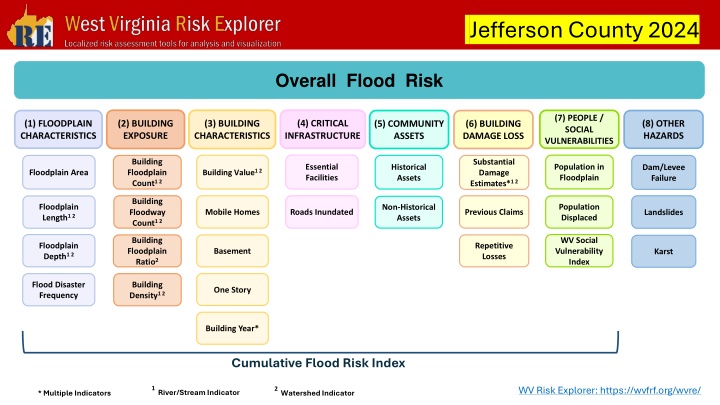
Jefferson County 2024 Overall Flood Risk (7) PEOPLE / SOCIAL VULNERABILITIES (4) CRITICAL INFRASTRUCTURE (2) BUILDING EXPOSURE (3) BUILDING CHARACTERISTICS (1) FLOODPLAIN CHARACTERISTICS (8) OTHER HAZARDS (6) BUILDING DAMAGE LOSS (5) COMMUNITY ASSETS Building Floodplain Count1 2 Substantial Damage Estimates*1 2 Essential Facilities Population in Floodplain Historical Assets Dam/Levee Failure Building Value1 2 Floodplain Area Building Floodway Count1 2 Population Displaced Floodplain Length1 2 Non-Historical Assets Mobile Homes Roads Inundated Previous Claims Landslides WV Social Vulnerability Index Building Floodplain Ratio2 Floodplain Depth1 2 Repetitive Losses Basement Karst Flood Disaster Frequency Building Density1 2 One Story Building Year* Cumulative Flood Risk Index WV Risk Explorer: https://wvfrf.org/wvre/ 1River/Stream Indicator 2Watershed Indicator * Multiple Indicators
Flood Risk Assessment Jefferson County Link to Flood Risk Comparison Report on WVRE: https://wvfrf.org/wvre/report/?scaleid=3&entityid=19&type=hierarchy Cumulative Flood Risk Index:
Flood Risk Assessment Jefferson County (1) Floodplain Characteristics: # Statewide Rank among the Top 5 Rankings done separately for counties, unincorporated areas, and 229 incorporated places 1 2 State Median: 1.8 Ft 4 State Median: 2.0 Ft Notes : Floodplain Area: Modified Floodplain Area (mSFHA) = Total Special Flood Hazard Area (aSFHA) [Open water lakes > 10 acres] [Large rivers bank-to-bank > 500 ft] [Federal lands > 10 acres] Floodplain Length: Total length of the Effective and Advisory Special Flood Hazard floodplains in miles Floodplain Length Breakdown: Jefferson County Detailed: 34.1%, Approximate: 52.3%, Advisory: 13.6% Harpers Ferry Detailed: 0%, Approximate: 68.5%, Advisory: 31.5% Shepherdstown Detailed: 50.7%, Approximate: 8.0%, Advisory: 41.3% Bolivar Detailed: 0%, Approximate: 100%, Advisory: 0% Charles Town Detailed: 54.9%, Approximate: 43.7%, Advisory: 1.3% Ranson Detailed: 93.6%, Approximate: 5.8%, Advisory: 0.6% Jefferson Unincorporated Area Detailed: 34.2%, Approximate: 54.6%, Advisory: 11.2% Floodplain Area Ratio: Ratio of the Modified Special Flood Hazard Area (mSFHA) to total incorporated place area Floodplain Length Ratio: Ratio of Special Flood Hazard length (Effective and Advisory) to total incorporated place area Flood Declared Disasters: Number of federally-declared flood disasters in the county since 1953 Flood Depth Median: Median value of flood depths of all primary structures inventoried in the High-Risk* flood zones from FEMA's models * High-Risk 100-year floodplain may include both Effective or Advisory Floodplains
Flood Risk Assessment Jefferson County (2) Building Exposure: # Statewide Rank among the Top 5 Rankings done separately for counties, unincorporated areas, and 229 incorporated places 3 2 State Median: 0.75 /Acre Notes : Building Floodplain Count: Building count in Special Flood Hazard Area including Effective, New Preliminary, and Draft floodplains (excluding mapped-out structures) Buildings in Floodplain Breakdown: Jefferson County in Effective: 376, in Advisory: 123 Shepherdstown in Effective: 47, in Advisory: 29 Ranson in Effective: 49, in Advisory: 1 Harpers Ferry in Effective: 1, in Advisory: 30 Charles Town in Effective: 17, in Advisory: 4 Bolivar in Effective: 0, in Advisory: 4 Jefferson Unincorporated Area in Effective: 262, in Advisory: 55 Building Floodway Count: Building count in Regulatory Floodway Building Floodplain Ratio: Percentage of floodplain buildings (in High-Risk* (100-yr) Effective or Advisory Floodplains) to total buildings Building Density: Density of buildings in High-Risk* flood areas to total floodplain acres * High-Risk 100-year floodplain may include both Effective or Advisory Floodplains
Flood Risk Assessment Jefferson County (3) Building Characteristics: # Statewide Rank among the Top 5 Rankings done separately for counties, unincorporated areas, and 229 incorporated places 1 4 State Median: $42,200 State Median: 21.6% 1 2 1 1 State Median: 25.5% State Median: 86.6% State Median: $41,500 1 2 Notes : State Median: $37,350 State Median: 19.5% Building Median Value: Median of appraised values of all primary structures in the High-Risk* 100-year floodplain from the most recent tax assessment data or other building value data sources for tax-exempt structures Bldg. Mobile Homes Ratio: Percentage of manufactured buildings (occupancy class code RES2) among all single-family structures (RES1 & RES2) in the High-Risk* 100-year floodplain Bldg. Subgrade Basements Ratio: Percentage of structures with subgrade basements among all primary structures in the High-Risk* 100-year floodplain (may also include walkout basement enclosures) Building 1-Story Ratio: Percentage of one-story structures among all primary buildings in the High-Risk* 100-year floodplain Bldg. Year Pre-FIRM Ratio: Percentage of buildings constructed or substantially improved on or before December 31, 1974, or before the effective date of the initial Flood Insurance Rate Map of the community, whichever is late (also including Post-FIRM construction regulated to Pre-FIRM and Unknown FIRM status) among all primary structures in the High-Risk* 100-year floodplain Bldg. Year Minus Rated Post-FIRM Ratio: Percentage of structures constructed after the FIRM date of which their first floor is more than one foot below the Base Flood Elevation (BFE) among all primary structures in the High-Risk* 100-year floodplain
Flood Risk Assessment Jefferson County (4) Critical Infrastructure: Notes : Essential Facilities: Number of essential facilities (including schools, hospitals, nursing homes, police stations, fire department buildings, & E-911 emergency operations centers) which provide critical services to the community in the high (100-year), moderate (500-year), and reduced risk flood zones Roads Inundated Ratio: Percentage of roads inundated by flood waters of 1 foot or more by a high-risk 1% annual chance (100-year) flood event
Flood Risk Assessment Jefferson County (5) Community Assets: # Statewide Rank among the Top 5 Rankings done separately for counties, unincorporated areas, and 229 incorporated places 4 State Median: 7 1 State Median: 1 Notes : Community Assets Historical: Number of historical community assets listed on the National Register of Historic Places or buildings within the Historic Districts constructed before 1930 in the High-Risk* 100-year floodplain Community Assets Non-Historical: Number of non-historical community assets including utilities, post-secondary educational facilities, EMS, government buildings providing public services, and religious buildings in the High-Risk* 100-year floodplain * High-Risk 100-year floodplain may include both Effective or Advisory Floodplains
Flood Risk Assessment Jefferson County (6) Building Damage Loss: # Statewide Rank among the Top 5 Rankings done separately for counties, unincorporated areas, and 229 incorporated places 1 State Median: 0.9% Notes : Bldg. Substantial Damage Count: Estimated number of primary structures substantially damaged from a 1% annual chance (100-year) flood for which the estimated flood loss is 50% or greater of the building appraised value Bldg. Substantial Damage Ratio: Percentage of substantially damaged structures to total floodplain structures Bldg. Previous Damage Claims: Number of previous flood-related insurance claims Bldg. Repetitive Loss Structures: Number of NFIP-insured structures that have had at least 2 paid flood losses of more than $1,000 each in any 10-year period since 1978
Flood Risk Assessment Jefferson County (7) People / Social Vulnerabilities: Notes : Population in Floodplain Ratio: Percentage of population residing in the High-Risk* Special Flood Hazard Area to total population Population Displaced Ratio: Estimated percentage of population displaced by a major storm of a 1% annual chance (100-year) probability to total population WV Social Vulnerability Index: Social vulnerability index developed for West Virginia based on the eight following socioeconomic and demographic indicators: Poverty Rate, Unemployment Rate, No High School Diploma Ratio, Vulnerable Ages Ratio, Disability Ratio, Population Change Ratio, Median Housing Value, and Mobile Homes Ratio in Total Area * High-Risk 100-year floodplain may include both Effective or Advisory Floodplains