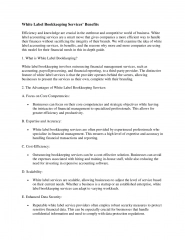
Job Creation and Funding Impact in K-12 LEAs
Explore the insights into job creation and funding allocation in K-12 Local Education Agencies (LEAs) through Proposition 39. The data includes total job creation, breakdown by job categories, total hours worked, average hourly wages, apprenticeships, and distribution of completed projects across the state. The forecasted potential job creation from Proposition 39 for FY 2013-2016 is also detailed, providing low and high estimates along with allocated funding figures.

Download Presentation

Please find below an Image/Link to download the presentation.
The content on the website is provided AS IS for your information and personal use only. It may not be sold, licensed, or shared on other websites without obtaining consent from the author. If you encounter any issues during the download, it is possible that the publisher has removed the file from their server.
You are allowed to download the files provided on this website for personal or commercial use, subject to the condition that they are used lawfully. All files are the property of their respective owners.
The content on the website is provided AS IS for your information and personal use only. It may not be sold, licensed, or shared on other websites without obtaining consent from the author.
E N D
Presentation Transcript
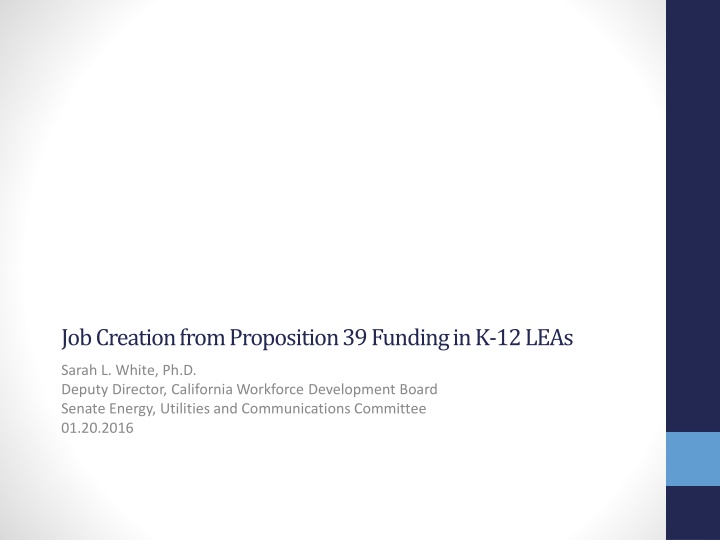
Job Creation from Proposition 39 Funding in K-12 LEAs Sarah L. White, Ph.D. Deputy Director, California Workforce Development Board Senate Energy, Utilities and Communications Committee 01.20.2016
Jobs Breakdown from K-12 LEAs Blue Collar, tracked by DIR 10.0% Data currently available from DIR tracking 30.0% Construction White Collar, estimates from secondary sources 59.4% Planning and Design, estimates from secondary sources 0.6%
Total Hours Worked by Building System in K-12 LEAs
Average Hourly Wage by Trade on K-12 LEA Projects Job Category Apprentices Journey-Level/ Non- Apprentices Electricians 30 53 Light Fixture Workers - 36 Sheet Metal Workers 26 49 Plumbers/Pipefitters 27 49 Carpenters 30 43 Asbestos/Lead Abatement Workers - 30 Other 24 45 Total 28 44
Distribution of K-12 LEA Projects Completed across the State
Forecasted Potential Job Creation from Proposition 39 (FY 2013-2016) Low Estimate DVC Jobs Forecaster High Estimate Total Allocated Funding ($M) Jobs per Mil. Fore- casted Direct Jobs Total Jobs (mult. =1.5) Jobs per Mil. Fore- casted Direct Jobs Total Jobs (mult. =2.3) Jobs per Mil. Fore- casted Direct Jobs Total Jobs (mult. =3) K-12 $973.4 2,434 6,085 6,035 13,881 8,663 34,652 Comm. Colleges $124.7 312 780 773 1,778 1,110 4,440 2.5 6.2 8.9 CCC $15.4 39 98 95 219 137 548 Total $1,113.5 2,784 6,963 6,903 15,878 9,910 39,640 Source: Don Vial Center on Employment in the Green Economy, Institute for Research on Labor and Employment, University of California, Berkeley