Joint Probability Density Functions in Physical Data Analysis
Learn about the significance of joint probability density functions in predicting random events involving correlated random fields, calculating probabilities, and analyzing the dependence between sets of random data. Explore concepts such as cross-correlation functions and cross-spectral density functions in the context of experimental methods in mechanical engineering.

Download Presentation

Please find below an Image/Link to download the presentation.
The content on the website is provided AS IS for your information and personal use only. It may not be sold, licensed, or shared on other websites without obtaining consent from the author. If you encounter any issues during the download, it is possible that the publisher has removed the file from their server.
You are allowed to download the files provided on this website for personal or commercial use, subject to the condition that they are used lawfully. All files are the property of their respective owners.
The content on the website is provided AS IS for your information and personal use only. It may not be sold, licensed, or shared on other websites without obtaining consent from the author.
E N D
Presentation Transcript
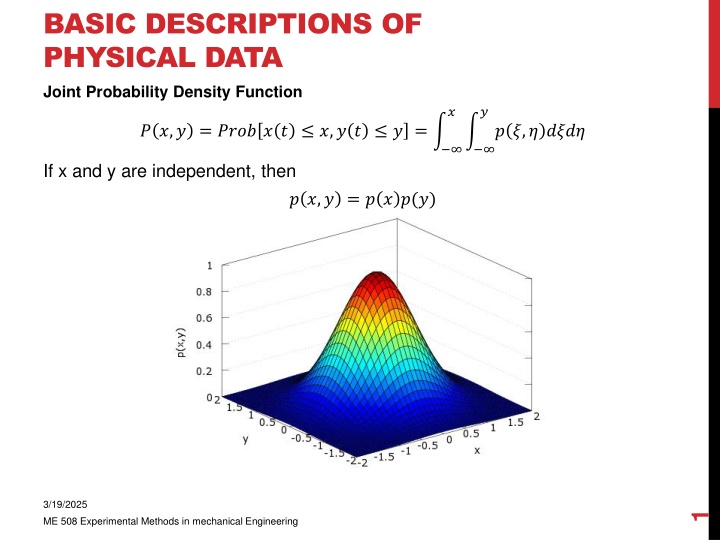
BASIC DESCRIPTIONS OF PHYSICAL DATA Joint Probability Density Function ? ? ? ?,? = ???? ? ? ?,? ? ? = ? ?,? ???? If x and y are independent, then ? ?,? = ? ? ?(?) 3/19/2025 1 ME 508 Experimental Methods in mechanical Engineering
BASIC DESCRIPTIONS OF PHYSICAL DATA Joint Probability Density Function ? ? ? ?,? = ???? ? ? ?,? ? ? = ? ?,? ???? The importance of the joint probability density function measurement is to determine the probability of occurrence of a random event associated with two sets of correlated random fields. Example, if two elastic structures are vibrating randomly, with some correlation, the joint pdf can predict collisions between both elements. The volume above the interval ?1< ? < ?2,?1< ? < ?2 gives the probability of x(t) and y(t) to lie in this interval. ?2 ?2 ???? ?1< ? < ?2,?1< ? < ?2 = ? ?,? ???? = ?1,2 ?1 ?1 The total volume under the joint pdf is equal to 1 ???? < ? < , < ? < = ? ?,? ???? = 1 3/19/2025 2 ME 508 Experimental Methods in mechanical Engineering
BASIC DESCRIPTIONS OF PHYSICAL DATA Cross-Correlation Functions The cross-correlation function between two sets of random data describes the dependence of one set on the other. Consider the time series of ?(?) and ?(?) The cross-correlation between ?(?) and ?(? + ?) can be calculated by taking the average product of the two data over the observation time T and taking the limit as T approaches infinity. 1 ? 0 The cross-correlation function is always real valued function It does not always have a maxima at the origin (? = 0). It is not an even function, however, it is symmetric if we switch the order of variables. ??? ? = ???? ?? ? ? ? + ? ?? ???? = lim ? ? 3/19/2025 3 ME 508 Experimental Methods in mechanical Engineering
BASIC DESCRIPTIONS OF PHYSICAL DATA Cross-Correlation Functions The absolute value of the cross-correlation function is bound by the following inequalities |???? |2 ??0 ??(0) |???? | 1 If ???? = 0, ?(?) and ?(?) are said to be uncorrelated. If ?(?) and ?(?) are statistically independent then ???? = 0 ? assuming ?(?) and ?(?) have zero mean. If ?(?) and ?(?) are statistically independent have non-zero mean, then, ???? = ???? ?. Applications: 1. Measurement of time delay 2. Determination of transmission paths 3. Detection and recovery of signals in noise 2??0 + ??0 ? 3/19/2025 4 ME 508 Experimental Methods in mechanical Engineering
BASIC DESCRIPTIONS OF PHYSICAL DATA Cross-Spectral Density Functions Recall that the spectral density function was the Fourier Transform of the autocorrelation function. Similarly, the cross-spectral density function is the Fourier Transform of the cross- correlation function. Since the cross-correlation function is not an even function the cross-spectral density function is in general a complex function such that, ???? = ???? ????(?) Where the real part, ???(?), is called the coincident spectral density function and the imaginary part, ???(?), is called the quadrature spectral density function. The coincident spectral density function can be viewed as the average of the product of ?(?) and ?(?) within the frequency interval [?,? + ?]. While the quadrature part is same except one signal (?(?) or ?(?) but not both) is time shifted such that there is a 90-degree phase shift at frequency ?. The cross-spectral density function can be written in polar form as, ???? = ???(?) ? ????(?) Where, 2(?) + ??? 2(?) ???(?) = ??? ???? = tan 1???? ???? 3/19/2025 5 ME 508 Experimental Methods in mechanical Engineering
BASIC DESCRIPTIONS OF PHYSICAL DATA Cross-Spectral Density Functions The cross-spectral density function is bound by the inequality, 2 ??? ??(?) ???? A real valued quantity related to the cross-spectral density function is the coherence function??? 2? defined as, 2 ???? ??? ??? 2? = ??? 1 When the coherence function is zero, ??? and ?(?) are said to be incoherent at that frequency, which is another term for uncorrelated. If ?(?) and ?(?) are statistically independent then, ??? If ??? Application: 1. Measurement of frequency response functions ???? = ? ? ??? ? ? = ???(?) ??(?) 2? = 0, at a particular frequency then, ?(?) 2? = 0 ?. 2? = 1 ?, then ?(?) and ?(?) are said to be fully coherent. 3/19/2025 6 ME 508 Experimental Methods in mechanical Engineering
BASIC DESCRIPTIONS OF PHYSICAL DATA Cross-Spectral Density Functions Application: 1. Measurement of frequency response functions ???? = ? ? ??? ? ? = ???(?) ??(?) 2. Measurement of Time Delays Time delay is calculated from the phase shift, ? = 3. Linear Prediction and Filter Theory ???? 2?? 3/19/2025 7 ME 508 Experimental Methods in mechanical Engineering