Key Insights on MLA Performance Trends in Assembly Reports
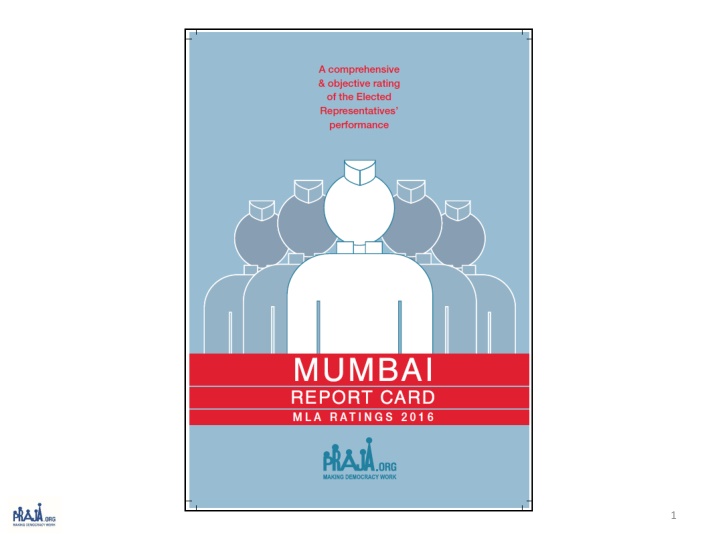
This content provides crucial insights into the performance trends of Members of the Legislative Assembly (MLAs) based on report cards from the 12th Assembly in 2011 to 2016. It discusses the average scores, individual MLA performances, question quality, and perceived accessibility. Additionally, it highlights the decline in MLA scores and the expectation for improvement in the current term. The impact of perceived corruption on quality of life, constitutional monitoring of Elected Representatives, and parameters for rating MLAs are also covered.

Download Presentation

Please find below an Image/Link to download the presentation.
The content on the website is provided AS IS for your information and personal use only. It may not be sold, licensed, or shared on other websites without obtaining consent from the author.If you encounter any issues during the download, it is possible that the publisher has removed the file from their server.
You are allowed to download the files provided on this website for personal or commercial use, subject to the condition that they are used lawfully. All files are the property of their respective owners.
The content on the website is provided AS IS for your information and personal use only. It may not be sold, licensed, or shared on other websites without obtaining consent from the author.
E N D
Presentation Transcript
Key insight Average score of 61.23% of the first report card for the 12th Assembly in 2011 and average score of 65.11% in 2016 the performance has increased. Two MLAs [Amin Patel (84.33%) & Sunil Prabhu (80.97%)] have scored above 80%. Score of top 20 percentile up from 71.14% in 2011 to 79.07% in 2016, while the laggards at the bottom remained more or less at the same level, from 52.82% in 2011 to 54.31% in 2016. Quality of questions asked by the MLAs up from 49.63% in 2011 to 57.93% in 2016 and total number of questions asked has decreased from 7946 questions in 2011 to 4343 questions in 2016. Score for Perceived Accessibility down from 66.05% in 2011 to 42.91% in 2016. During the last (12th) assembly the average scores of the MLA s showed a decline over the four report cards from 61.23% in 2011 to 59.17% in 2014. We would expect that the current group of MLAs defy the trend and increase their average performance from 65.11% in 2016 by the time we come up with the last report card for this term in 2019. 2
PERCEIVED CORRUPTION & ITS IMPACT ON QUALITY OF LIFE 3
The Constitution as a Basis for monitoring of Elected Representatives ERs derive their powers for functioning through the Constitution They are mandated to Attend Sessions, Raise people s Issues, Debate, Participate in Discussions and Pass legislations. The Constitution defines their powers and rules of functioning, hence only the Constitution can provide the parameters for their monitoring. 4
Parameters for Rating MLAs (1/4) Parameter Marks Present1(Attendance, No. & Quality of Questions, Usage of Area Development Fund) Past2(Education qualification, PAN Card, Criminal cases) Perception(through an citizen survey of 25,215 people for their perception on their MLA s accessibility/availability, performance, corruption, and satisfaction with quality of life, services provided by government) Negative for new FIR cases after 2014 election 3 Negative for pending Charge Sheet 3 Total 52 8 40 Minus 5 Minus 5 100 RTI Data Source: 1 Vidhan Bhavan and City & Suburban Collector Offices; 2 Election Commission of India s Website; 3 Mumbai Police. 6
Parameters for Rating MLAs (2/4) Present Parameter (Marks) Sessions Attended Based on percentage of attendance. 1) 100% to 91%- 10; 2) 90% to 76% - 8; 3) 75% to 61% -6; 4) 60% to 51% - 4; and 5) below 50% - 0 Number of Questions Asked Against Group Percentage Rank. 16 being the top most percentile and so on to the lowest for 1 Importance of questions asked Weightage is given to issues raised through the questions depending on whether they belong to the State List, Central List or are in the domain of Municipal Authority. In the aggregate scale (out of 100) the following weightage is given: Constituency (including City) gets 5; State gets 15; and National gets 1 Total Local Area Development Funds Utilised during Oct 2014 to March'2016 Calculation for the current financial year is done for the sanctioned fund of Rs. 2.50 crore.1) 100% (or more) to 91%- 5; 2) 90% to 76% - 4; 3) 75% to 61% -3; 4) 60% to 51% - 2; and 5) below 50% - 0 10 16 21 5 7
Parameters for Rating MLAs (3/4) Past Parameter (Marks) Education Qualification A minimum of 10th Pass - 1; if not 0 1 Income Tax !) Possessing PAN Card - 1 2) Filling of last years IT returns 1 2 Criminal Record If the candidate has zero cases registered against her/him, then 5; else as below: 1) Criminal Cases Registered containing the following charges: Murder, Rape, Molestation, Riot, Extortion - 0 2) Other criminal cases than the above mentioned 3 5 8
Parameters for Rating MLAs (4/4) Perception Parameter (Marks) Perception of Public Services Score on Public Services Awareness & Accessibility Score on Awareness amongst people about their representative, their political party and ease of access to the representative Corruption Index Score on perceived personal corruption of the representative Broad Measures Score on overall satisfaction and improvement in quality of life 20 6 10 4 9
Party INC SS INC BJP INC SS INC INC BJP SS BJP BJP BJP SS SS BJP SP SS BJP SS BJP BJP SS SS AIMIM BJP SS BJP SS SS BJP MLAs Name Score 84.33 80.97 79.40 78.35 75.76 75.63 72.54 72.13 68.81 68.80 67.98 67.40 67.13 66.38 65.88 65.71 63.04 60.85 60.14 59.70 59.27 58.60 58.37 57.77 57.71 57.21 56.25 54.51 54.39 53.96 49.55 Rank 1 2 3 4 5 6 7 8 9 10 11 12 13 14 15 16 17 18 19 20 21 22 23 24 25 26 27 28 29 30 31 Amin Amir Ali Patel Sunil Waman Prabhu Varsha Eknath Gaikwad Yogesh Sagar Aslam Ramazan Ali Shaikh Sunil Govind Shinde Kalidas Nilkanth Kolambkar Md. Arif (Naseem) Lalan Khan Sardar Tara Singh Ajay Vinayak Choudhari Atul Bhatkhalkar Ashish Babaji Shelar Mangal Prabhat Lodha Sadanand Shankar Sarvankar Prakash Vaikunt Phaterpekar Manisha Ashok Chaudhary Abu Asim Azmi Ashok Dharmaraj Patil Bharati Hemant Lavekar Tukaram Ramkrishna Kate Ameet Bhaskar Satam Raj Purohit Sanjay Govind Potnis Sunil Rajaram Raut Waris Yusuf Pathan Selvan R. Tamil Prakash Rajaram Surve Parag Madhusudan Alavani Ramesh Kondiram Latke Mangesh Anant Kudalkar Ramchandra Shivaji Kadam 10
MLAs with criminal cases before elections 45% MLAs have criminal cases. 14 MLAs out of 31 have criminal cases (FIRs) registered against them and of the 14 MLAs, 12 have charge sheets filed against them before elections as per their election affidavits. 11
THANK YOU!!! 18


")
")
")
")