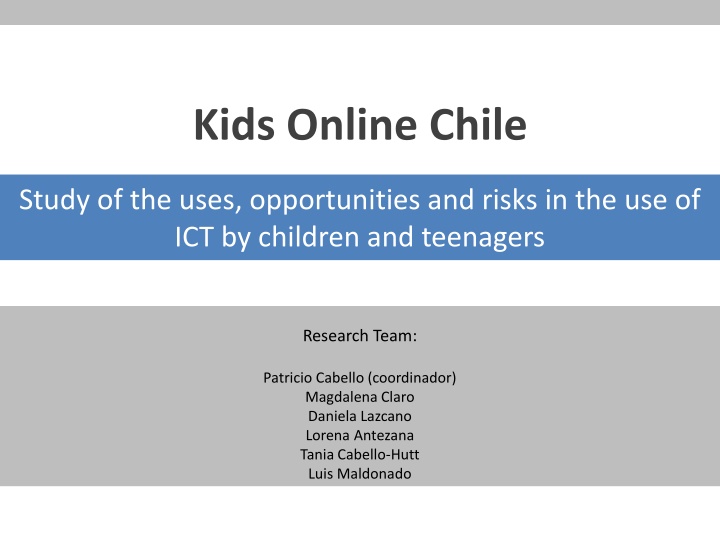
Kids Online Chile
This study explores the utilization, advantages, and hazards associated with the use of Information and Communication Technology (ICT) by children and teenagers in Chile. The research team aims to understand the digital behaviors of young individuals, focusing on aspects such as access, skills, mediations, and risks. Conducted between August and October 2016, this investigation involved a significant sample size to provide insightful findings.

Download Presentation

Please find below an Image/Link to download the presentation.
The content on the website is provided AS IS for your information and personal use only. It may not be sold, licensed, or shared on other websites without obtaining consent from the author.If you encounter any issues during the download, it is possible that the publisher has removed the file from their server.
You are allowed to download the files provided on this website for personal or commercial use, subject to the condition that they are used lawfully. All files are the property of their respective owners.
The content on the website is provided AS IS for your information and personal use only. It may not be sold, licensed, or shared on other websites without obtaining consent from the author.
E N D
Presentation Transcript
Kids Online Chile Study of the uses, opportunities and risks in the use of ICT by children and teenagers Research Team: Patricio Cabello (coordinador) Magdalena Claro Daniela Lazcano Lorena Antezana Tania Cabello-Hutt Luis Maldonado
Kids Online Chile. Study of the uses, opportunities and risks in the use of ICT by children and teenagers To describe the uses, opportunities and risks in the use of ICT by children and teenagers in Chile Objective Length of Field Work August to October 2016 Population 1.456.422 inhabitants between 9 and 17 years old 1000 children and teenagers between 9 and 17 years old, plus a parent or the main carer Sample Size Sampling Design Random with three stages Sample Error 3,1% National (urban areas of more than 100.000 inhabitants and less than 70.000 in the 15 regions of the country) Internet users with ages between 9 and 17 years (User= has used internet at least once in the last 3 months). Internet users with ages between 9 and 17 years , and a parent or the main carer Face to Face CAPI at home (parents and children and teenagers between 9 and 17 years old) Self-Applied at home(CAPI): children and teenagers between 9 and 17 years old Representativeness Level Target Population Qualified Informant Instruments application modality Responsable Institution Pontificia Universidad Cat lica de Valpara so Centro de Estudios de Pol ticas y Pr cticas en Educaci n, CEPPE-UC; Instituto de Comunicaci n e Imagen, U. Chile Collaborator Institutions Institution that does the Field Work Ipsos Chile 3
Instrument Dimensions Children and Teenagers Parents/Carers Way of application Dimensions measured in the study Way of application Dimensions measured in the study Identity and resources (part 1) Child caracterization Access Access Opportunities and uses/practices Opportunities and uses/practices Face to Face Digital ecology Digital ecology Abilites (self-perception) Abilites (self-perception) Undesired sexual experiences Risks and security perception Worries about the rising and development of the children Face to Face Wellfare Family Culture Family Risk Perception Self-Applied School Harm Perception Risks and security perception Peers and Comunity Identity and resorces (part 2) Sociodemography and description of the home a key informant 5
Results 6
In this Presentation Access Opportunities/practices Skills Mediations Risks 7
Access to digital technologies Access Technology availability in the context, considering places, devices, time and connectivity level 8
Equipment Significant Differences in the equipment by socio- economical group (SEG) Desk Computer 64% 52% 51% 42% C1-C2 C3 D-E Total High coverage of smartphones, though a mild breach between SEG Notebook 96% 81% 79% 67% C1-C2 C3 D-E Total Smartphone 98% 92% 91% 91% C1-C2 C3 D-E total 9 Base: Children and teenagers users of the Internet (n=1000)
Equipment Houses pretty connected (higher to the SUBTEL measurement, 2016 =70%) Conectivity Differences Internet connection at home 96.6% 89.9% 84.5% 70.9% 76% of the houses connected to the Internet C1-C2 C3 D-E Total ADSL at home 90.4 79.8 76 Significant Differences by SEG 62 C1-C2 C3 D-E Total Base: Children and teenagers users of the Internet (n=1000) 10
Intensity in the use of the Internet How frequently do you use the Internet? Almost never (4,3) Differences in the intensive use At least once a month (1,4) Everyday several times a day (SEG) At least once a week (5,9) 60.5% 53.2% 50.2% 40.9% C1-C2 C3 D-E Total Everyday several times a day (50,3) Everyday several times a day (Age) Everyday or almost everyday (38) 65.00% 50.30% 45.60% 26.70% 9 a 10 9 to 10 14 a 17 14 to 17 11 a 13 11 to 13 Total Everyday several times a day (Gender) Significant differences by SEG Frequency grows with age Girls report a more frequent use 53.5% 50.3% 47.2% Hombre Men Mujer Women Total 11 Base: Children and teenagers users of the Internet (n=1000)
Time spent on the Internet Monday to Friday: 32% uses half an hour or less Weekends: 50% uses 5 or more hours Mean Monday to Friday: 2.3 hours Mean Weekends: 4.29 hours Mean Total Week: 19.9 hours 50 Time used and moment of the week 32 28 20 19 19 19 11 1 a 2 horas 3 a 4 horas Half an hour 2 hours 5 or more 3 to 4 hours media hora o menos or less 5 o m s horas hours media hora o menos or less 1 a 2 horas 3 a 4 horas Half an hour 2 hours 5 o m s horas hours 5 or more 3 to 4 hours Lunes a viernes Monday to Friday Fin de semana Weekends 12 Base: Children and teenagers users of the Internet (n=1000)
Time spent on the Internet Aproximate mean of the use (a day of the week and a day of the weekend) 4.6043 The older, the more frequent the use 3.71 3.527 3.026 2.5277 1.9175 11 a 13 11 to 13 9 a 10 9 to 10 14 a 17 14 to 17 11 a 13 11 to 13 14 a 17 14 to 17 9 a 10 9 to 10 Fin de semana Weekends Lunes a viernes Monday to Friday 13 Base: Children and teenagers users of the Internet (n=1000)
Time spent on the Internet D-E gruops have a significant lower mean from Monday to Friday Aproximate mean of the use (a day of the week and a day of the weekend) 4.4 4.4 3.9 2.6 2.4 2.0 On weekends, there are no significant differences C1-C2 C3 D-E C1-C2 C3 D-E Lunes a viernes Monday to Friday Fin de semana Weekends 14 Base: Children and teenagers users of the Internet (n=1000)
Places of Internet usage Frequency per place of access to the Internet (home and school) 33,6% never accesses at school Hogar Home Escuela School 60 53.2 53,2% accesses everyday, several times a day at home 50 40 33.6 31.3 30 16 15.3 14.8 20 13.3 7.2 4.4 10 3.9 2.5 2.2 1.9 0.3 0 Everyday or almost everyday Casi nunca Al menos Almost never At least once a week Nunca Never At least once a month Everyday, several times a day Al menos una vez a la semana Todos o casi todos los d as Todos los d as, varias veces al d a Ns/NR NA una vez al mes 15 Base: Children and teenagers users of the Internet (n=1000)
Practices and Opportunities on the Internet Opportunities Activities in which children and teenagers get involved and have a potential benefit. 16
Practices and Opportunities In the last month: Formal learning 84% used it to do homework from school Informal learning 84% used it to watch videos or tutorials Entertainment Play on the Internet: 69% Social Relations 73% social network Citizenship 7,9% Discusses social and political problems 36% Reads/watch news Personal 40% looked for information about health Activities and opportunities Last 3 months Last Month Learn something new 79 69 Use the Internet to do homework 93 84 84 28 91 69 Education/Learning Watch videos or tutorial on the Internet Look for information regarding job or study opportunities Watch videos Play on the Internet 91 39 95 79 Entertainment Create videos or music and share them on the Internet 19 11 Create a blog, a tale or a web page 10 Creative 5 Publish videos or music found on the Internet 44 32 Learn about activities in your neighborhood 36 23 Comunity Talk to people from other cities or countries 29 23 Join web pages with sharing interests or hobbies 32 24 Personal Look form information on the Internet regarding health or diseases 52 40 Participate in pages of social causes or charity 11 6,7 7,9 Discuss social or political problems 13 Participate in a campaign or a manifestation 9 5,7 Ciudadan a Support a cause signing a petition 7 3 Join a citizen, religious or political group 6 3 36 Read/Watch news on the Internet 47 Share photos, videos or music 71 59 73 Use a social network 80 Social Network Talk to family or friends who live far away 64 54 Chat (e.g. Whatsapp, Line, Gmail Chat, Hangout, Facebook Chat, Skype, etc.) 87 81 N_C4. How often have you done these things ONLINE in the past month? 17 Base: Children and teenagers users of the Internet (n=1000)
Practices and Opportunities Look form information on the Internet regarding health or diseases Learn something new Use the Internet to do homework Watch videos or tutorial on the Internet Look for information regarding job or study opportunities Factor Analysis: Creativity and entertainment are part of the same dimension Education/Learning Watch videos Entertainment and Creativity Play on the Internet Create videos or music and share them on the Internet Create a blog, a tale or a web page Participate in pages of social causes or charity Community and citizenship are part of the same dimension Discuss social or political problems Participate in a campaign or a manifestation Community and citizenship Support a cause signing a petition Join a citizen, religious or political group Read/Watch news on the Internet Learn about activities in your neighborhood Share photos, videos or music Use a social network Talk to family or friends who live far away Chat (e.g. Whatsapp, Line, Gmail Chat, Hangout, Facebook Chat, Skype, etc.) Join web pages with sharing interests or hobbies Publish videos or music found on the Internet Share photos, videos or music Social Relations 18
Practices and Opportunities Community and citizenship Education/Learning The older, the more activities SEG no significant Gender no significant The older, the more activities SEG no significant Girls report more activities Social Relations Entertainment and creativity The older, the more activities SEG no significant Gender no significant Group of 9 to 10 years, more activities SEG no significant Boys report more activities 19
Self-Perception of digital skills Digital skills Self-Perception of the capacity to do social, informational, creative, operational and mobile activities 20
Self-Perception of skills Self-Perception of skills Operational, mobile and social skills stand out A little or nothing capable I don t understand what it means Totally or pretty capable Keep Track of the costs of the mobile applications that you use 33 56 10 Mobile More than half declares not being aware of the different types of licenses or permits on the Internet Installing applications on a mobile device 84 16 1 Recognize the different types of licenses or permits on Internet 32 55 13 Operational Change your privacy options 51 42 6 Save a picture that you find on Internet 67 33 1 40% reports feeling a little or nothing capable to confirm if the information found is true Choose which words to use for searching something on Internet 67 29 4 Navigate Check if the information found is right or true 57 40 2 Delete people from your contact list 74 24 1 Social Recognize which information you should not share on Internet 67 29 3 Upload videos or music that you created Creative 36 62 1 N_E1. How capable do you feel to ? 21 Base: Children and teenagers users of the Internet (n=1000)
Who is skilled in what? Skills do not group in different factors Self-Perception of the skill in one dimension is similar to the self- perception in the rest Digital Skill The result is consistent with the evaluation on the performance of digital skills 22
Who have greater digital skill? Significant differences across SEG: Lower SEG report a lower digital skill Significant differences across age: The older, the higher digital skill No significant differences between boys and girls Significant differences by the educational level of the head of the household: Those from households with heads with low educational level (measured as low, medium and high) show a lower digital skill mean. 23
Parental Mediations Mediations Strategies of regulation that parents do in order to maximize the benefits and minimize the risks of the use of the Internet by their children 24
Perception of active mediation of the parents/carers 62% report that their parents/carers advice them on how to use the Internet frequently Always or almost always Sometimes Never or almost never Advice on the safe way to use the Internet 62 17 22 Explain why some pages are good or bad 57 18 26 Help you do or find something on the Internet Talk about what to do if something upsets you on the Internet Help when something upsetted you on the Internet Encourage you to explore and learn thing on the Internet on your own Talk about what you do on the Intenet Being around when you use the Internet 52 18 29 47 21 32 57% report that their parents/carers explain why some pages are good or bad frequently 42 18 39 42 23 35 43 28 29 The activities of co-using or co-navigation are less frequent (less than a third answers always or almost always) 41 30 29 Speak about comercial ads that may appear on the internet 34 21 45 Sit whith them while you are using the Internet, without participating in what you are doing Do activities with you on the Internet 30 28 42 24 23 51 N_I4. When you use the internet, how often does your parent/carer do any of these things? Base: Children and teenagers users of the Internet (n=1000) 25
Differences in the Self-Report of Parental Mediation Active mediation No differences between SEG Gender Differences: Girls mediation mean is significantly higher Differences across ages Curve Shaped: The group from 11 to 13 report higher mediation than the younger (9 to 10) and the older (14 to 17) Parents that are long time users do significantly more mediations than those who use it from less time or haven t used it at all 26
Differences in the Self-Report of Parental Mediation Restrictive mediation Age: The older the lower restrictive mediations No significant differences across seg Gender: Men report more restrictive mediations No significant differences from the experiences of the parents as Internet users (users/non users; how long have been using it) 27
Perception of active mediation by the teacher Nunca o casi nunca Siempre o casi siempre A veces Encourage you to explore and learn thing on the Internet on your own Advice on the safe way to use the Internet A little more than a third reports that their teaches mediate always or almost always the use of internet 40 24 35 42 21 36 Explain why some pages are good or bad 45 19 36 Help you do or find something on the Internet A little over half reports that their teacher has never or almost never mediated when something upsetted them on the internet 35 21 44 Talk about what to do if something upsets you on the Internet 33 22 45 Give you suggestions about how to behave with other people on the Internet 34 19 45 Help when something upsetted you on the Internet 30 15 54 Talk about what you do on the Internet 23 20 57 N_J1. N_I4. When you use the internet, how often does your teacher do any of these things? (%) 28 Base: Children and teenagers users of the Internet (n=1000)
Risks Risks Risk is not present but possibility. It mustn t be confused with harm. Risk is not something that happens, but a set of conditions that mediate the probability of something negative happening 29
Risky Situations Risky practices are infrequent 85% has never pretended to be someone else 85% has never sent photos/videos. Intensive practice in just 2% Never Almost Never At least once a moth At least once a week Everyday or almost everyday Eveyday, several times a day Rather not answer Doesn t Know Total Look for new friends on the Internet 41,0 26,4 8,3 8,1 7,2 5,7 1,7 1,5 100 Send personal infor mation (e.g. full name, adress, phone number) to someone whom I don t know personally Add people that I don t know personally to my friends or contacts list 74,0 12,0 1,8 3,9 2,3 2,1 1,7 2,2 100 52,5 22,7 7,7 6,5 3,8 3,3 1,8 1,7 100 Pretend to be someone else on the Internet 84,8 7,0 1,5 1,0 1,3 1,4 1,5 1,5 100 Send a photo or a video of me to someone whom I don t know personally 85,5 6,3 1,4 1,4 1,8 1,1 1,1 1,4 100 A_F1. In the PAST YEAR, how often have you done these things online? 30 Base: Children and teenagers users of the Internet (n=1000)
Risks and Perception of Harm Children and teenagers Internet users in Chile 36% has had at least one experience on the Internet that have made them feel bad 59% report NEVER having an experience on the Internet that have made them feel bad Never Once or twice At least once a month At least once a week Everyday or almos everyday Rather not answer Doesn t Know 59,1 23,7 6,9 3,2 1,7 1,7 3,7 36% have had an experience that made them feel bad in the last year To a very little percentage of them is a regular experience A_F12. n the PAST YEAR, how often did something happened online that bothered or upset you in some way (e.g., made you feel uncomfortable, scared or that you shouldn t have seen it)? 31 Base: Children and teenagers users of the Internet (n=1000)
Support in negative situations 50% teenagers that had a negative experience on the Internet, sought for support (parents, teachers, etc.) of children and Yes 50,4 No Rather not answer 42,2 5,5 Doesn t know 1,9 Total 100 N_F14. The last time something happened online that bothered or upset you, did you talk to anyone of these people about it? Base: Children and teenagers with a negative experience (n=355) Parents/carers of whom had a negative experience (base: 355) Parents/carers of whom never had a negative experience (base: 645) Parents/carers of all the users of internet (base: 1000) No significant difference in the search for support when the negative situation hasn t happened Never or almost never Sometimes Always or almost always NA 35 39 38 22 17 19 42 43 43 0,2 1 0,8 P_I2.- How frequent does (Name of the Child) tells you about things that have upsetted him/her on the Internet? 32
Risks and negative experiences Adding unknown people is a differentiating practice A_F11. In the PAST YEAR, has anything EVER happened online that bothered or upset you in some way? Those who never added strangers tend to have less negative experiences Never Once or twice At least once a month At least once a week Everyday or almost everyday Rather not say NA A_F1. In the PAST YEAR, how often have you done these things online? Send a picture or a video to someone who have never met face-to-face.. Corrected P value=0-000. Chi- square=51.892, df=2 Those who add strangers frequently, tend to be less safe from negative experiences 33
Risks and negative experiences " Added people to my friends or contacts I have never met face- to-face" Significant differences between boys and girls Girls tend to do it, while boys tend to avoid it Never At least once NA Boys 48% 49% 3% Girls 57% 39% 3,8% C1-C2 C3 55% 55% 44% 42% 1% 3% Significant differences across ages Practice increases with age Relationship with autonomy D-E 48% 47% 5% 9 to 10 75% 20% 5% 11 to 13 58% 39% 4% 14 to 17 38% 60% 2% Big urban area 52% 44% 4% No significant differences by urban size and SEG Small urban area 53% 44% 3% 34
Sexual Content Doesn t know (3%) Rather not answer (8%) *Section applied only to children and teenagers between 11 and 17 years. No significant differences across SEG Significant differences across age: The older, the higher proportion No significant differences between men and women (though a mild higher tendency in women) Yes (29%) No (60%) N_F28. In the PAST YEAR, have you EVER SEEN any sexual images? Base: Children and teenagers between 11 and 17 a os (n=780) 35
Sexual Content Sexual Images and Discomfort: 64% not good, nor bad Doesn t know (3%) Rather not answer (8%) 7.1 No s I don t know Rather not answer 3.8 Prefiero no Yes (29%) 5.2 Me sent muy mal Very bad 10.1 Bad Me sent mal 64.8 Ni bien , ni mal Not good, nor bad No (60%) Good 5.4 Me sent bien Me sent muy bien Very good 3.7 0 50 100 N_F28. In the PAST YEAR, have you EVER SEEN any sexual images? Base: Children and teenagers between 11 and 17 a os (n=780) A_F29 How did you feel about what you saw? Base: Children and teenagers whom saw any sexual image in the last year (n=229) 36
Sexual Content Naked people is not pornography Between those who said seen this kind of images (n=229) 39,8% declares seeing them on television 76,5% on the Internet 10% in a magazine or book In a magazine or book 10,2 On television (e.g. movie) 39,8 On the Intenet, using a cellphone, tablet, comuter, etc. . 76,5 A_F31: The last time you saw images of this kind, where did you see them? Base: Children and teenagers whom saw any sexual image in the last year (n=229) 37
Conclusions and Discussion Survey rescues the perception of children and teenagers in Chile Children and teenagers are home are more connected than the general population High access to Smartphones Use as an opportunity for formal and informal learning SEG produces significant differences in access, use intensity and skills Age is a relevant cross variable: use intensity, opportunities, skills, mediation and risks 38
Conclusions and Discussion Gender learning/education and entertainment/creativity and the kind of mediation Opportunities increases entertainment/creativity Digital skill: Educational level of the head of the household is important in digital skills (cultural capital of the family) SEG is not significant in opportunities but it is for the skills Perception of risk increases with age and is higher in men than women Perception of support differences the use intensity, opportunities for with age, except in 39
THANK YOU 40