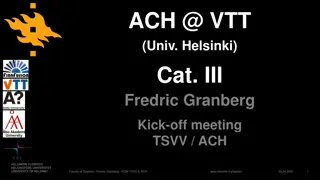
Kumpula Physics Work-Related Stress Survey Findings
In a survey conducted at the HIP Helsinki Institute of Physics, responses on work-related stress factors, coping mechanisms, and seeking help were gathered. Participants indicated stress levels linked to work aspects like job description, behavior, facilities, and more. The survey also explored participants' abilities to seek help and if they had sought assistance for their stress. Interestingly, common stressors mentioned were uncertainty about the future, problems with supervisors, and mismatch between personal values and work requirements. The findings provide insights into the work environment and stress management at Helsinki University's physics department.

Download Presentation

Please find below an Image/Link to download the presentation.
The content on the website is provided AS IS for your information and personal use only. It may not be sold, licensed, or shared on other websites without obtaining consent from the author.If you encounter any issues during the download, it is possible that the publisher has removed the file from their server.
You are allowed to download the files provided on this website for personal or commercial use, subject to the condition that they are used lawfully. All files are the property of their respective owners.
The content on the website is provided AS IS for your information and personal use only. It may not be sold, licensed, or shared on other websites without obtaining consent from the author.
E N D
Presentation Transcript
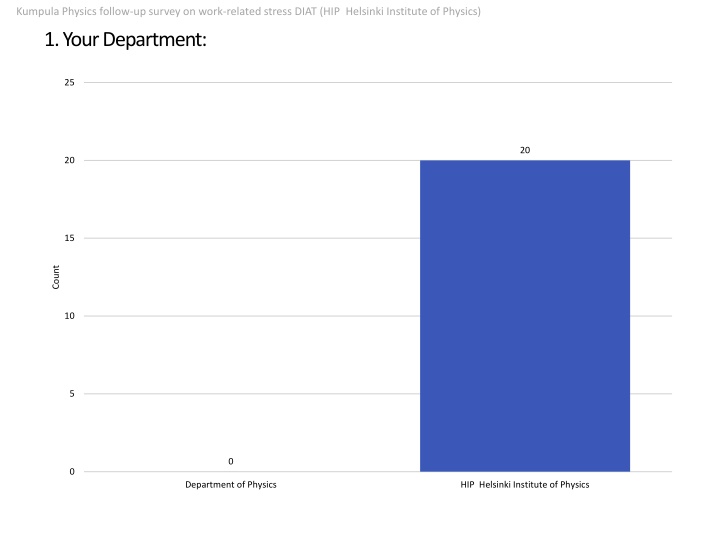
Kumpula Physics follow-up survey on work-related stress DIAT (HIP Helsinki Institute of Physics) 1. Your Department: 25 20 20 15 Count 10 5 0 0 Department of Physics HIP Helsinki Institute of Physics
Kumpula Physics follow-up survey on work-related stress DIAT (HIP Helsinki Institute of Physics) 2. Which of the following best describes your position at the University of Helsinki? 9 8 8 7 6 5 Count 4 4 3 3 3 2 1 1 0 0 0 Administrative staff Undergraduate / Master s student /Research Assistant PhD Student / Doctoral Student. Postdoctoral researcher Senior Technical staff Other research/teaching staff
Kumpula Physics follow-up survey on work-related stress DIAT (HIP Helsinki Institute of Physics) 5. Some examples of work-related stress are listed below. Please indicate on a scale from 1 to 5 (or N/A) how much work-related stress these cause you. Too much work 0.0% 10.0% 10.0% 15.0% 35.0% 25.0% 5.0% Unclear job description 26.3% 21.1% 10.5% 0.0% 15.8% 21.1% 5.3% Inappropriate behaviour 35.0% 5.0% 10.0% 15.0% 15.0% 15.0% 5.0% Facilities 35.0% 40.0% 10.0% 5.0% 5.0% 0.0% 5.0% Responsibility for others (coworkers, students, employees, etc) 20.0% 15.0% 25.0% 15.0% 10.0% 10.0% 5.0% 0 (Not stressful) 1 Problems with supervisor/boss 45.0% 25.0% 5.0% 5.0% 10.0% 5.0% 5.0% 2 Uncertain future 10.0% 15.0% 10.0% 10.0% 15.0% 40.0% 0.0% 3 4 Lack of control 20.0% 15.0% 10.0% 25.0% 15.0% 15.0% 0.0% 5 (Very stressful) N/A Unequal treatment 45.0% 10.0% 15.0% 5.0% 5.0% 10.0% 10.0% Feeling an outsider 40.0% 10.0% 10.0% 20.0% 5.0% 5.0% 10.0% Mismatch between my own values and work requirements 40.0% 15.0% 10.0% 10.0% 20.0% 0.0% 5.0% Competition 30.0% 10.0% 25.0% 5.0% 20.0% 5.0% 5.0% 0% 10% 20% 30% 40% 50% 60% 70% 80% 90% 100% Percent
Kumpula Physics follow-up survey on work-related stress DIAT (HIP Helsinki Institute of Physics) 6. Do you know who to contact for help regarding the reasons you gave for your work-related stress? Yes 80.0% No 20.0% 0% 10% 20% 30% 40% 50% 60% 70% 80% 90% 100% Percent
Kumpula Physics follow-up survey on work-related stress DIAT (HIP Helsinki Institute of Physics) 7. If so, have you sought help? Yes 36.8% No 63.2% 0% 10% 20% 30% 40% 50% 60% 70% 80% 90% 100% Percent
Kumpula Physics follow-up survey on work-related stress DIAT (HIP Helsinki Institute of Physics) 8. During the last 6 months, have you experienced any of the following? problems in making easy decisions 55.6% problems in remembering (short-term memory) 66.7% problems in sleeping 55.6% problems with eating (loss of appetite/weight gain etc) 50.0% 0% 10% 20% 30% 40% 50% 60% 70% 80% 90% 100% Percent