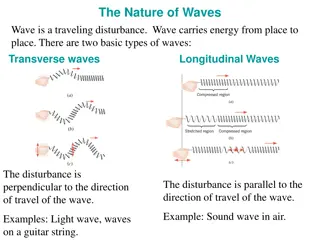
Kuznets Waves and Inequality Cycles

This content discusses Kuznets waves, the cyclical nature of the Kuznets curve, and key differences between pre-industrial and industrial societies regarding income cycles and inequality. It showcases historical data from Spain to illustrate these concepts.

Download Presentation

Please find below an Image/Link to download the presentation.
The content on the website is provided AS IS for your information and personal use only. It may not be sold, licensed, or shared on other websites without obtaining consent from the author.If you encounter any issues during the download, it is possible that the publisher has removed the file from their server.
You are allowed to download the files provided on this website for personal or commercial use, subject to the condition that they are used lawfully. All files are the property of their respective owners.
The content on the website is provided AS IS for your information and personal use only. It may not be sold, licensed, or shared on other websites without obtaining consent from the author.
E N D
Presentation Transcript
Kuznets waves Based on B. Milanovic, Global inequality: A new approach for the age of globalization, Chapter 2
A1. Kuznets waves in societies with a stagnant mean income 2
Cyclical nature of the Kuznets curve: Land rental/wage ratio over the long-term in Spain, 1282-1842 140 120 Napoleonic wars 100 Wars, decline of wool exports Wool and wine production, rising demand for land, commercial society Land rental/wage ratio 80 60 Plague 40 20 0 1282 1294 1306 1318 1330 1342 1354 1366 1378 1390 1402 1414 1426 1438 1450 1462 1474 1486 1498 1510 1522 1534 1546 1558 1570 1582 1594 1606 1618 1630 1642 1654 1666 1678 1690 1702 1714 1726 1738 1750 1762 1774 1786 1798 1810 1822 1834 1846 From Prados de la Escosura & Alvarez-Nogal, The rise and fall of Spain 800-1850 3
Kuznets curve here? No. GDP per capita and rent-wage ratio: Spain 1325-1840 140 120 100 Lad rent/wage ratio 80 Land/wage 60 40 20 0 0 10 20 30 40 50 60 70 80 90 100 GDP per capita (1859-100) From Prados de la Escosura & Alvarez-Nogal, The rise and fall of Spain 800-1850 4
Key idea & key difference between pre- industrial and industrial societies Kuznets cycles in pre-industrial societies are visible only over time (since income is quasi fixed). They are mostly driven by non- economic changes: conquests, wars, epidemics. Link between Kuznets and Malthusian cycles in pre-industrial societies; but Kuznets cycles are broader because they are not necessarily driven by demographic changes Little room for large increases in inequality because the average income level was very low (recall the inequality extraction ratio: inequality is limited by the level of average income) 5
A2. Kuznets waves in societies with a rising mean income 6
Malign and benign forces reducing inequality (downward portion of the Kuznets wave) Malign Benign Societies with stagnant mean income Idiosyncratic events: wars (though destruction), epidemics, civil conflict Cultural and ideological (e.g. Christianity?) Societies with a rising mean income Wars (through destruction and higher taxation: War and Welfare), civil conflict Widespread education (reflecting changing returns) Social pressure through politics (socialism, trade unions) Aging (demand for social protection) Low-skill biased TC Cultural and ideological (pay norms?) 7
Kuznets relationship for the UK, 1688-2014 60 1867 1913 50 1688 Gini of disposable per capita income 40 2014 1993 30 1962 1978 20 10 0 1000 10000 100000 GDP per capita (in 1990 international dollars; Maddison)
Kuznets relationship for the United States, 1774-2013 60 1860 1933 50 1929 2013 1774 Gini of disposable per capita income 40 1947 1979 30 20 10 0 1000 10000 100000 GDP per capita (in 1990 international dollars; Maddison)
Downswing of Kuznets first cycle and upswing of the second Kuznets cycle in advanced economies Level of maximum inequality (peak of Wave 1) Gini points (year) Level of minimum inequality (trough of Wave 1) (year) Approximate number of years of downswing of the Kuznets wave Reduction in inequality (Gini points) GDP increased (how many times) during the downswing The second Kuznets wave (increase in Gini points) 51 (1933) 35 (1979) 50 16 4 United States Strong (+8) 57 (1867) 27 (1978) 110 30 >4 UK Strong (+11) 53 (1918) 31 (1985) 70 22 <5 Spain Modest (+3) 51 (1851) 30 (1983) 120 21 <9 Italy Strong (+5) 55 (1937) 31 (1981) 45 24 6 Japan Modest (+1) 61 (1732) 21 (1982) 250 35 7 Netherlands Modest(+2) 10
Average per decade real per capita growth and Gini change during the downward portion of the first Kuznets wave (the Great Levelling) 0 0 10 20 30 40 50 60 70 -1 Average change in Gini points per decade Netherlands 1732-1982 -2 Italy 1861-1983 -3 UK 1867-1978 USA 1933-1979 -4 -5 Japan 1937-1981 -6 -7 Spain 1953-1985 -8 Average real per capita growth rate per decade 11
What drives 1st Kuznets wave down and 2nd Kuznets wave up? Downward portion of Kuznets 1 ~1900 to 1980 Upward portion of Kuznets 2 1980-? Malign forces (wars) Wars Hyperinflation (against creditors) Benign forces (economics, social, demography) Social pressure through politics (socialism, trade unions) High taxation Widespread education Aging (demand for social protection) Movement of labor from manufacturing into heterogeneous services Rents from tech innovations Globalization Technological change Free global movement of capital Policy changes (endogenous) TOP impossible to disentangle 12
Brazil, Chinas inequality in the Kuznets framework Brazil 60 50 China Gini 40 0 5000 10000 15000 GDP per capita twoway (scatter Giniall gdpppp if contcod=="CHN" & year>1960, connect(l) ylabel(40(10)60) xtitle(2000 6000 12000) ytitle(Gini) xtitle(year)) (scatter Giniall gdpppp if contcod=="BRA", connect(l) text(62 12000 "Brazil") text(48 12000 "China") legend(off)) Using gdppppreg5.dta 13
The plateaing of the urban Gini in China, 1981-2016 0.35 0.30 0.25 0.20 Gini 0.15 0.10 0.05 0.00 1980 1985 1990 1995 2000 2005 2010 2015 14 Source: Milanovic and Zhang
All-China All-China estimated Gini (1985-2015) 0.60 0.50 0.40 Gini 0.30 0.20 1985-2002 Wu and Perloff 2003-2015 NSB official estimates 0.10 0.00 1985 1990 1995 2000 2005 2010 2015
Where are now China and the US? First Kuznets wave Second Kuznets wave Gini China 2013 United States 2013 GDP per capita
What might drive the 2nd Kuznets wave down? Progressive political change (endogenous: political demand) Dissipation of innovation rents Low-skilled biased technological progress (endogenous) Reduction of the skill premium if quality of education becomes more equal De-concentration of ownership of capital 17
Is this an optimistic or pessimistic theory of changes in income inequality? The question boils down to whether there are endogenous forces that would curb and check increase in income inequality under capitalism Such forces can be benign: political pressure and greater taxation, ideology, low-skill biased technological change, greater supply of educated labor, aging population and demand for social services Or they can be malign: as they were in the run up to World War I where insufficient domestic demand led to the competition for control of colonies (imperialism) and ultimately war Malign forces cannot be excluded today. 18
Last slide: Methodological notes Economics of inequality will be patterned neither after biology nor physics, but history. This is because of the complexity of the outcome variable (income or wealth inequality) which cannot be explained by economic processes alone, but by interactions of politics, economics, demography, policy etc. It is illusory to expect to have a purely economic and narrowly defined model that explains movements of inequality. Neither HOS, nor r>g, nor race between skills technology will alone do it. Complexity of the problem does not allow for a simple or mathematically satisfying explanation. The objective: plausible narratives supported by empirical evidence.