Labour Relations Dashboard 2019-2020 Overview
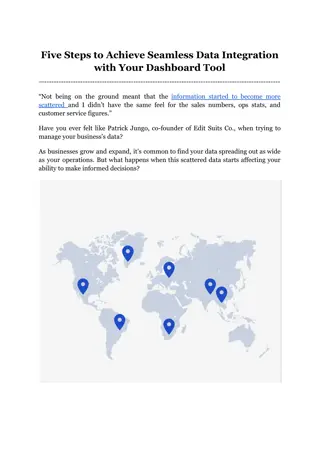
Explore the detailed analysis of workplace relations, grievances, harassment complaints, and violence incidents in the Labour Relations Dashboard 2019-2020 presented at the HRLMCC meeting. Get insights into the number of grievances by branch, types of complaints, and more to understand the state of employee relations within the organization.

Download Presentation

Please find below an Image/Link to download the presentation.
The content on the website is provided AS IS for your information and personal use only. It may not be sold, licensed, or shared on other websites without obtaining consent from the author. If you encounter any issues during the download, it is possible that the publisher has removed the file from their server.
You are allowed to download the files provided on this website for personal or commercial use, subject to the condition that they are used lawfully. All files are the property of their respective owners.
The content on the website is provided AS IS for your information and personal use only. It may not be sold, licensed, or shared on other websites without obtaining consent from the author.
E N D
Presentation Transcript
LABOUR RELATIONS DASHBOARD 2019-2020 Presented at the Human Resources Labour-Management Consultative Committee (HRLMCC) October 9, 2020
DISCLAIMER NOTE The organizational data reflected in this dashboard is mainly sourced by MyGCHR and Discoverer. Please note that the Labour Relations team has undertaken a major review of its data integrity and will continue this exercise in the coming years. Hence, changes that have not been updated in MyGCHR as of March 31, 2020 are not reflected in this data source. As part of our validation process to ensure accurate and reliable people management information in support of government reporting and decision-making, we require that any high-profile/high visibility products (e.g. presentations to the Executive Management Committee, responses to media requests, public reports, etc.) developed by you or your teams using our information, be validated with us prior to finalizing or using the products. The information/data attached, whether it is in print, electronic or any other form, should be treated as restricted and is to be used for the intended purposes. SECURITY All use of the information/data attached must abide by the Privacy Act and information/data must be safeguarded in a manner that respects the federal Privacy Act (http://laws-lois.justice.gc.ca/eng/acts/P- 21/page-1.html) and the Policy on Government Security (https://www.tbs-sct.gc.ca/pol/doc- eng.aspx?id=16578). 2
OBJECTIVES To provide a sense of the state of workplace relations: Grievances : grievances by branch and type, pay grievances, average response time, grievances by union affiliation and by level Harassment complaints Violence in the workplace complaints (Part XX of CLC)
DEPARTMENTAL OVERVIEW ECCC active employees* by branch Number of grievances received in FY 2019-2020 by branch As of April 1, 2019 As of March 31, 2020 As of April 1, 2019 As of March 31, 2020 % representing the number of employees by branch % representing the number of employees by branch Branch Total % Total % Branch Total Total N/A A&E 21 0,3% 28 0,4% A&E 1 0,7% 5 4,8% PIAMS 270 4% 251 3,5% PIAMS 13 7,6% 6 5,7% CSFB 856 12,9% 914 12,6% CSFB N/A 33 0,4% 13 0,1% DMO DMO 6 3,4% 1 1% 574 8,4% 727 10,0% CWS CWS 39 22,4% 14 13,5% 435 6,4% 450 6,2% ENF ENF 25 14% 7 6,6% 916 13,4% 999 13,7% EPB EPB 291 4,3% 316 4,4% 1 1% HRB HRB 86 1,2% 95 1,3% N/A IAB IAB N/A LEGAL 12 0,2% 13 0,1% LEGAL 68 39% 40 38,5% MSC 1460 21,3% 1505 20,7% MSC 17 9,9% 24 23,1% S&T 1441 21,1% 1470 20,2% S&T 1 0,7% 5 4,8% SPB 357 5,2% 366 5,0% SPB Pan-Canadian Framework Group grievances Pan- Canadian Framework Total N/A 63 0,9% 124 1,7% 4 2,3% 1 1% 6815 100% 7271 100% 174 100% 104 100%4 Total *Population includes active employees and those on leave.
GRIEVANCES BY BRANCH In 2019-2020, there were 104 new grievances compared to 174 in 2018-2019. Meteorological Services Canada, representing 21% of the total workforce, is the branch with the most grievances. This represents 39% of all departmental grievances. Pay grievances related to Phoenix issues represent 49% of the total grievances for that branch. Science and Technology branch, representing 20% of the total workforce, is the second branch with the most grievances (with 23% of all departmental grievances). 250 200 150 100 50 0 Group grievanc es CORP SEC A&E CFSB CWS ENF EPB HRB MSC S&T SPB PIAMS PCFIO Total FY 2017-2018 13 7 30 32 93 23 6 3 1 208 FY 2018-2019 13 6 39 25 68 17 1 1 4 174 FY 2019-2020 6 1 14 7 1 40 24 5 5 1 104 5
GRIEVANCES BY TYPE 250 200 150 100 50 0 Pay Pay - other (System related) 151 115 51 T&C Classif. Disability Discipline NJC Discrim. Leave Perform. Harassm. OHS Staffing Union rep. Total FY 2017-2018 FY 2018-2019 FY 2019-2020 9 9 1 12 9 9 5 6 11 4 1 3 4 1 5 6 8 4 1 1 1 2 5 2 1 208 174 104 10 4 15 9 3 5 2 1 In FY 2019-2020, there were 51 new pay grievances compared to 115 received in 2018-2019. Grievances related to Phoenix has proven to be a yearly trend for the past 3 years. However, we have noted a major decrease of pay grievances in 2019-2020. The three most grieved matters in FY 2019-2020 are: Pay system related Discipline Disability and classification (ex quo) 6
GRIEVANCES RELATED TO PAY (PHOENIX) Overall* Open Pay Grievances 100 89 90 Total as of March 31, 2020: 242 of all pay grievances are referred to adjudication 80 24% 70 59 60 50 39 40 26 30 20 13 Status of pay grievances 9 10 4 2 1 0 29% Open Closed MSC has the most pay grievances related to Phoenix with 89 cases that are still open (37%). 71% 7 * Numbers reflect the total of grievances since the implementation of the Phoenix system on February 12, 2016. .
GRIEVANCES RELATED TO PAY (PHOENIX) CONT D Status of pay grievances Over years* (As of March 31, 2020) FY 2019-2020 51 new pay grievances (system related) were received 339 97 242 25were placed in abeyance 19 99 17 were closed Total received Closed (including withdrawal) Open (including abeyance) Referred to adjudication Abeyance As of March 31, 2020, there was 242 active pay grievances (system related). * Numbers over years reflect the total of grievances since the implementation of the Phoenix system on February 12, 2016. 8
AVERAGE RESPONSE TIME BY UNION AFFILIATION FY 2019-2020 PSAC / UHEW PIPSC PIPSC Resolved grievances Average response time Resolved grievances Average response time Grievances other than pay Grievances other than pay 11 115 days 5 74 days Pay Pay 1 125 days 15 68 days grievances* grievances* Average response time Resolved grievances CAPE Pay grievance* 1 12 days *For pay grievances, there is a small number of cases for which the status has yet to be confirmed which may influence the number of resolved grievances. 9
AVERAGE RESPONSE TIME BY LEVEL OF GRIEVANCE OFFICER Average response time for grievances other than pay 1 Average response time for pay grievances 2 Average response time for grievances other than pay1 Average response time for pay grievances2 Level Level 1 76 days 19 days PSAC PIPSC PSAC PIPSC CAPE 85 days 55 days 125 days 13 days 12 days 1 2 46 days 8 days 57 days 31 days N/A 8 days N/A 2 3 103 days 59 days 103 days N/A N/A 59 days N/A 3 1Average response time only includes closed grievances (received in 2019-2020) and excludes those that were withdrawn. 2 Numbers reflect total of pay grievances since the implementation of the Phoenix system. 10
GRIEVANCES BY UNION AFFILIATION PER BRANCH Total grievances received in FY 2019-2020 Total PIPSC UHEW-PSAC CAPE 6 CSFB 6 1 CWS 1 14 ENF 1 12 1 7 EPB 3 3 1 40 MSC 16 24 24 S&T 16 8 5 PIAMS 5 5 SPB 2 3 Total 37 60 5 102 11
CLOSED GRIEVANCES BY LEVEL Total of closed grievances by level FY 2019-2020 1st Level 2nd Level 3rd Level Total CSFB 3 3 ENF 1 1 EPB 3 1 4 MSC 1 2 9 12 S&T 2 3 5 10 PIAMS 1 SPB 2 2 Total 13 6 14 33 Out of 104 received grievances in FY 2019-2020, 33 were closed within that year. 12
HARASSMENT COMPLAINTS HARASSMENT COMPLAINTS RECEIVED AND CARRIED FORWARD BY YEARLY COMPARISON 2019-2020 Closed Withdrawn Investigated 2018-2019 2019-2020 18 16 14 12 30% 10 40% 8 6 4 2 0 ENF S&TPIAM CSF B 1 2 MSC EPBPCFI IAB SPB HRB Total 30% S 1 1 O 2 0 2018-2019 2019-2020 3 2 0 0 4 2 4 3 1 0 0 3 1 0 17 13 There is an decrease in the number of active harassment complaints as 5 new complaints were received in 2019-2020 compared to 12 in 2018-2019. 8 complaints were carried forward from last year, bringing the total of complaints to 13 for 2019- 2020 compared to 17 active complaints for 2018-2019. In 2019-2020, of those 13 complaints: 3 cases were closed (2 unfounded and 1 resolved informally), 3 were withdrawn, 3 are under review and 4 are under investigation. In 2019-2020, complaints mostly fall under the ground of disrespectful relations (59%). *As for April 1, 2018, the harassment prevention coordinator function was transferred out of labour relations to the Values, Integrity and Disclosure Division (VIDD) in Wellness services. 13
VIOLENCE IN THE WORKPLACE COMPLAINTS 1 Dismissed 1 5 In Progress 2 In 2019-2020, 4 complaints were received: 3 are closed 1 is in progress Informally Resolved 1 3 Withdrawn 1 Unfounded 1 Founded 1 Informally Resolved Founded Unfounded Withdrawn In Progress Dismissed 2019-2020 2018-2019 2017-2018 1 1 1 5 2 1 3 1 1 14