Laser Wavefront-based Classification in LWFA for Electron Acceleration
Explore the use of Laser Wavefront-based Classification in successful injection for Electron Acceleration in LWFA technologies. Learn about the ATLAS-3000 system, electron energy stability, and shot-to-shot fluctuations in laser output compared to electron energy in LWFA.
Download Presentation

Please find below an Image/Link to download the presentation.
The content on the website is provided AS IS for your information and personal use only. It may not be sold, licensed, or shared on other websites without obtaining consent from the author. If you encounter any issues during the download, it is possible that the publisher has removed the file from their server.
You are allowed to download the files provided on this website for personal or commercial use, subject to the condition that they are used lawfully. All files are the property of their respective owners.
The content on the website is provided AS IS for your information and personal use only. It may not be sold, licensed, or shared on other websites without obtaining consent from the author.
E N D
Presentation Transcript
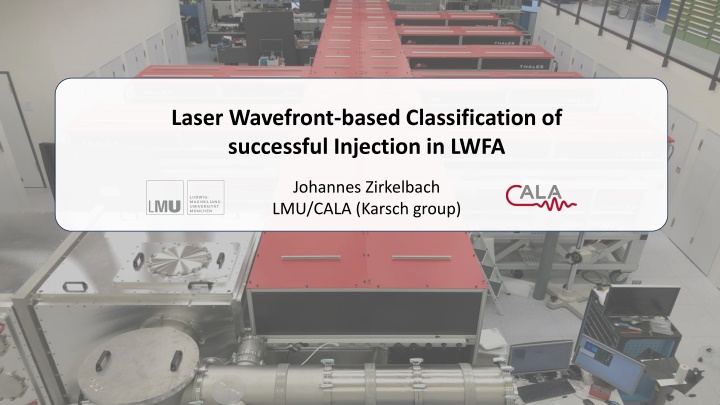
Laser Wavefront-based Classification of successful Injection in LWFA Johannes Zirkelbach LMU/CALA (Karsch group)
ATLAS-3000 (Garching/LMU/Centre for Advanced Laser Applications) ~100 m Wavelength: 800 nm (Ti:Sa) Pulse duration: 27 fs Pulse energy: ~70 J (curr.: ~20 J) Repetition rate: 1 Hz Applications: Electron acceleration X-ray generation Ion acceleration Fundamental research 2
ATLAS-3000 (Garching/LMU/CALA) Frontend (-> 2 J) Data discussed today: LWFA with slit nozzle and optical injection From: PhD thesis of M. F rster Hydrogen Main Amplifier (-> 20-30 J) ~8 J on target 26 fs pulse duration f/56 20 mm Beamline & Labs From: PhD thesis of K. von Grafenstein 3
Electrons from LWFA driven by ATLAS-3000 Shots without injection into the first bubble Shot-to-shot fluctuations Drift Why? Laser output appears more stable than LWFA electrons: Shot Electron Energy (MeV) 4
Laser Parameters are more stable than Electron Energy Shots without injection into the first bubble Shot-to-shot fluctuations Drift Why? Laser output appears more stable than LWFA electrons: Shot Electron Energy (MeV) 5
Laser Parameters are more stable than Electron Energy Shots without injection into the first bubble Shot-to-shot fluctuations Drift Why? Laser output appears more stable than LWFA electrons: Shot Electron Energy (MeV) 6
Laser Parameters are more stable than Electron Energy Shots without injection into the first bubble Shot-to-shot fluctuations Drift Why? Laser output appears more stable than LWFA electrons: Shot Norm. Intensity 6 cm Electron Energy (MeV) 7
Laser Parameters are more stable than Electron Energy Shots without injection into the first bubble Shot-to-shot fluctuations Drift Why? Laser output appears more stable than LWFA electrons: ~6% Shot ~0.5% Electron Energy (MeV) 8
~2000 Shot Data Set for Statistical Analysis ~2000 shot series at 0.25 Hz repetition rate Recorded without actively changing any parameters Successful injection only in 2/3 of the cases: No/little injection into the first bubble Injection into the first bubble Shot Why does this vary? 37% 63% Electron Energy (MeV) 9
Diagnostics at ATLAS-3000 and in LWFA Lab Record in sync with the electron spectra: Laser pulse energy Laser pulse spectrum Laser beam nearfield 10
Diagnostics at ATLAS-3000 and in LWFA Lab Record in sync with the electron spectra: Laser pulse energy Laser pulse spectrum Laser beam nearfield Laser beam pointing 11
Diagnostics at ATLAS-3000 and in LWFA Lab Record in sync with the electron spectra: Laser pulse energy Laser pulse spectrum Laser beam nearfield Laser beam pointing Laser output wavefront 12
Diagnostics at ATLAS-3000 and in LWFA Lab Record in sync with the electron spectra: Laser pulse energy Laser pulse spectrum Laser beam nearfield Laser beam pointing Laser output wavefront Laser pulse spectrum (probe) Laser pulse duration (probe) Laser beam pointing (probe) Laser probe pulse energy 13
Diagnostics at ATLAS-3000 and in LWFA Lab Record in sync with the electron spectra: Laser pulse energy Laser pulse spectrum Laser beam nearfield Laser beam pointing Laser output wavefront Laser pulse spectrum (probe) Laser pulse duration (probe) Laser beam pointing (probe) Laser probe pulse energy Plasma density (interferometer) Shock position Gas pressure 14
Diagnostics at ATLAS-3000 and in LWFA Lab Record in sync with the electron spectra: Laser pulse energy Laser pulse spectrum Laser beam nearfield Laser beam pointing Laser output wavefront Laser pulse spectrum (probe) Laser pulse duration (probe) Laser beam pointing (probe) Laser probe pulse energy Correlation matrix Plasma density (interferometer) Shock position Gas pressure Electron beam pointing Electron energy spectrum Accelerated charge 15
Correlation between LWFA Electrons and Laser Parameters High correlation between electron energy and wavefront coefficients Electron pointing Frontend output Electron energy Laser output Gas pressure Laser energy Probe beam wavefront & charge pointing 16
Correlation between LWFA Electrons and Laser Parameters ? = 0.56 Injection into the first bubble No/little injection into the first bubble Defocus Zernike coefficient at the laser output vs. maximum electron energy Electron pointing Frontend output Electron energy Laser output Gas pressure Laser energy Probe beam wavefront & charge pointing 17
Classification of Injection based on Wavefront Can predict based on the laser wavefront whether ????> 700 ???? 37% 63% Average wavefront at the laser output: ? = i ?????? ????> 700 ??? ????< 700 ??? ???? difference 18
Classification of Injection based on Wavefront Can predict based on the laser wavefront whether ????> 700 ???? AUC = 0.87 37% 63% Average wavefront at the laser output: ? = i ?????? ????> 700 ??? ????< 700 ??? ???? difference 19
Classification of Injection based on Defocus Can predict based on the defocus parameter whether ????> 700 ???? AUC = 0.87 AUC = 0.81 37% 63% How to improve classification? - More information on target parameters (?) - Pulse front tilt/curvature (?) - (?) How to move on from here? 1. Understand physics/run simulations. 2. Reduce defocus fluctuations. 20
Fluctuations in Focus Position Defocus fluctuations during the experiment: RMS = 1.2% ? ~1.6 ?? 30 min Sensor repeatability: < 2 ?? = 0.25% ? Focal shift ??: 2 ?2 ??= 16 3 f# f #= 56 0 ???[??] = 0.8 ??
Fluctuations in Focus Position Defocus fluctuations during the experiment: RMS = 1.2% ? ~1.6 ?? 4 min Sensor repeatability: < 2 ?? = 0.25% ? Focal shift ??: 2 ?2 ??= 16 3 f# f #= 56 0 ???[??] = 0.8 ??
Fluctuations in Focus Position Defocus fluctuations during the experiment: Upstream of target/shock RMS = 1.2% ? ~1.6 ?? Downstream of target/shock Sensor repeatability: < 2 ?? = 0.25% ? Focal shift ??: What causes these defocus fluctuations? 2 ?2 ??= 16 3 f# f #= 56 0 Candidates: Fluctuations in the amplifier crystal temperature Air humidity fluctuations Air turbulence ???[??] = 0.8 ??
Where do the Defocus Fluctuations come from? Temperature distribution in laser crystals, in particular at the main AMP: Cooling from the side via index-matched liquid ? 9 cm IR camera IR-image of AMP1 laser crystal while pumped with 4 Gaias Pump lasers Seed Pump lasers Seed Ti:Sa 24
Does the Thermal Lens induce Defocus Fluctuations? Temperature distribution in laser crystals, in particular at the main AMP: Pump lasers off Pump lasers on ? 9 cm IR-image of AMP1 laser crystal while pumped with 4 Gaias 25
Does the Thermal Lens induce Defocus Fluctuations? Thermal lenses in laser crystals, in particular at the main amplifier: Pump lasers off Pump lasers on ? 1 ? 9 cm 0 ?2 ( ?) 0.6 ? = 0.15? Thermal lensing 4 ? ? IR-image of AMP1 laser crystal while pumped with 4 Gaias Correlation between ? and defocus coefficient fluctuations? Expected defocus RMS: 0 ?2 ( ?) 0.13 ? = 2% ? Measured defocus RMS: 1.2% ? Might be measuring additional thermal dynamics that is not relevant for the defocus at the laser shots. 26
Does the Thermal Lens induce Defocus Fluctuations? Thermal lenses in laser crystals, in particular at the main amplifier: Pump lasers off Pump lasers on ? 1 ? 9 cm 0 ?2 ( ?) 0.6 ? = 0.15? Thermal lensing 4 ? ? IR-image of AMP1 laser crystal while pumped with 4 Gaias Correlation between ? and defocus coefficient fluctuations? Expected defocus RMS: ? = 0.06 0 ?2 ( ?) 0.13 ? = 0.02 ? Based on our current measurement, we can not directly explain the defocus fluctuations based on thermal lens fluctuations in the main AMP crystal. 27
Do Air Humidity Fluctuations induce Defocus Fluctuations? The air humidity control in the ATLAS-3000 lab sometimes creates spikes (during the winter time ):
Do Air Humidity Fluctuations induce Defocus Fluctuations? The air humidity control in the ATLAS-3000 lab sometimes creates spikes (during the winter time ): Measurement with cw-diode; only using part of the full laser chain.
Do Air Humidity Fluctuations induce Defocus Fluctuations? The air humidity control in the ATLAS-3000 lab sometimes creates spikes (during the winter time ): For operation of the full laser chain: 0 2.5% ? humidity % ??????? ?2 humidity Typical defocus RMS: 1.2% ? sub-percent-level humidity fluctuations could influence the defocus in the laser output notably. Measurement with cw-diode; only using part of the full laser chain. How does air humidity affect the laser wavefront?
Do Air Humidity Fluctuations induce Defocus Fluctuations? The air humidity control in the ATLAS-3000 lab sometimes creates spikes (during the winter time ): For operation of the full laser chain: 0 2.5% ? humidity % ??????? ?2 humidity Typical defocus RMS: 1.2% ? sub-percent-level humidity fluctuations could influence the defocus in the laser output notably. Test with humidifier close to adaptive mirror ( DM1 ): Hypothesis: Water accumulates in (porous E- beam) coatings and creates stress. The flexible substrates of the adaptive mirrors deform more readily than thicker, regular substrates. Main deformation: curvature -> introduces defocus.
Reducing Crystal Temperature in the Main Amplifier Temperature profile of the AMP1 crystal: Crystal mount Cooling liquid Pump lasers Pump lasers 9 cm Seed Seed Ti:Sa 32
Reducing Crystal Temperature in the Main Amplifier Temperature profile of the AMP1 crystal: Crystal mount Cooling liquid Air flow/ turbulence Pump lasers 9 cm Seed 20 C Ti:Sa 40 C Upgrade heat exchanger Flow speed -> 2x Chiller temperature 18 C-> 15 C 30 C 36 C Seeing indications that wavefront overall becomes more stable by cooling the crystal. Main AMP output Needs confirmation! Frontend output 33
Conclusions Subtle fluctuations in the laser wavefront can induce substantial fluctuations in the energy of LWFA electrons and determine to a good extent whether injection takes place or not. Among all Zernike coefficients, defocus (and astigmatism) have the strongest impact on electron energy and injection probability. The defocus fluctuations might be caused by a combination of temperature fluctuations in the main amplifier crystal, humidity fluctuations, and air turbulence. Will look into this in more detail. Reducing the temperature of the main amplifier crystal appears to reduce (higher-order) wavefront fluctuations. 34
Conclusions Subtle fluctuations in the laser wavefront can induce substantial fluctuations in the energy of LWFA electrons and determine to a good extent whether injection takes place or not. Among all Zernike coefficients, defocus (and astigmatism) have the strongest impact on electron energy and injection probability. The defocus fluctuations might be caused by a combination of temperature fluctuations in the main amplifier crystal, humidity fluctuations, and air turbulence. Will look into this in more detail. Reducing the temperature of the main amplifier crystal appears to reduce (higher-order) wavefront fluctuations. 36
Correlation between LWFA Electrons and Laser Parameters Mean Electron Energy (MeV) ? = 0.6 Defocus at Laser Output (?) Defocus Zernike coefficient vs. average electron energy Electron pointing Frontend output Electron energy Laser output Gas pressure Laser energy Probe beam wavefront & charge pointing 37
Correlation between LWFA Electrons and Laser Parameters Defocus @ Laser Output Standardized time series Electron Max. Energy Defocus and the maximum electron energy fluctuate in sync on a timescale of minutes. Smoothed Time Series 30 min Shot Number (Rep. rate: 0.25 Hz) 38
Correlation between LWFA Electrons and Laser Parameters Defocus @ Laser Output Standardized time series Electron Mean Energy Defocus and mean electron energy fluctuate in sync on a timescale of minutes. Smoothed Time Series 30 min Shot Number (Rep. rate: 0.25 Hz) 39

