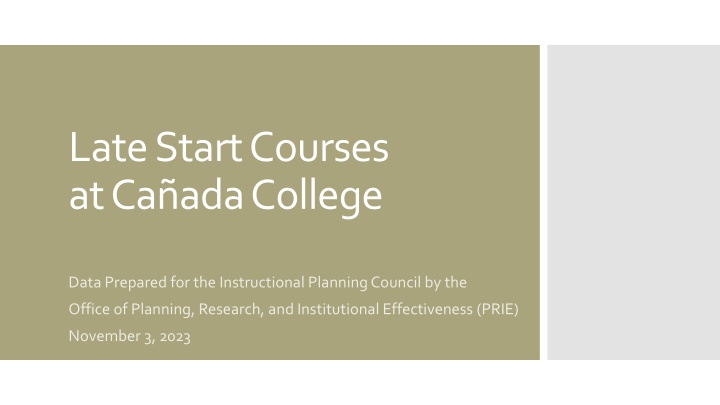
Late Start Courses at Cañada College Data Analysis
This analysis delves into the performance and enrollment trends of late-start courses at Cañada College over multiple terms. The study evaluates the sweet spot for course duration and the impact on factors like enrollment, success rates, and withdrawal rates. By comparing late-start and full-term sections, insights are gained on the effectiveness of different course lengths and formats. Additionally, the analysis includes the mean age distribution of students in late-start versus full-term sections.

Download Presentation

Please find below an Image/Link to download the presentation.
The content on the website is provided AS IS for your information and personal use only. It may not be sold, licensed, or shared on other websites without obtaining consent from the author.If you encounter any issues during the download, it is possible that the publisher has removed the file from their server.
You are allowed to download the files provided on this website for personal or commercial use, subject to the condition that they are used lawfully. All files are the property of their respective owners.
The content on the website is provided AS IS for your information and personal use only. It may not be sold, licensed, or shared on other websites without obtaining consent from the author.
E N D
Presentation Transcript
Late Start Courses at Ca ada College Data Prepared for the Instructional Planning Council by the Office of Planning, Research, and Institutional Effectiveness (PRIE) November 3, 2023
Should the college schedule more late start classes or not? What is the sweet spot for late start classes? Research Questions 14 weeks, 12 weeks, 10 weeks, or 8 weeks? Higher enrollment? Higher success rates?
Late Start courses: Fall and Spring terms Less than 17 weeks in duration Start after the first week of the term, for example: 14-week courses start week 4 12-week courses start week 6 10-week courses start week 8 8-week courses start week 10 Analysis of Late Start Courses Parameters: Terms: Fall 2021, Spring 2022, Fall 2022, Spring 2023 Units: 3 unit Less than 3 units - support and independent study, some CTE and labs More than 4 units - ESL Independent Study excluded
Section Count % of Total Sections Census Enrollment Fill Rate Success Rate Withdraw Rate Late Start vs. Full Term 3-Unit Courses Late Start Sections 133 12% 2,946 62% 69% 15% Full-Term Sections 988 88% 19,202 60% 74% 10% Overall 1,121 100% 22,148 60% 74% 10%
Section Count % of Total Sections Census Enrollment Fill Rate Success Rate Withdraw Rate Late Start vs. Full Term 3-Unit Courses Late Start - Day 13 10% 223 50% 73% 10% Full Term - Day 294 30% 4,496 49% 75% 10% Late Start - Evening 8 6% 139 49% 69% 10% Day, Evening, and Online* Full Term - Evening 83 8% 837 37% 73% 13% Late Start - Online 112 84% 2,584 64% 69% 15% Full Term - Online 610 62% 13,849 68% 74% 9% *Online courses are fully online; hybrid courses are included under Day or Evening based on in-person meeting time(s)
Late Start Sections Full Term Sections Mean Age Overall 29 26 Late Start vs. Full Term 57% 60% Day 29 23 50% 45% Evening 31 28 40% Online* 29 27 30% 19% Age 17% 20% 15% 12% 8% 10% 6% 6% 5% 5% 4% 0% Age Under 18 Age 18 - 22 Age 23 - 28 Age 29 - 39 Age 40 - 49 Age 50 + Late Start Full Term *Online courses are fully online; hybrid courses are included under Day or Evening based on in-person meeting time(s)
Section Duration (weeks) Part Of Term Start Date Section Count Census Enrollment Success Rate Withdra w Rate Fill Rate 7 Start Week 11 8 221 71% 56% 17% Fill and Success Rates by Section Duration 8 Start Week 10 7 182 74% 64% 17% 9 Start Week 9 3 44 68% 64% 5% 12 Start Week 6 4 109 99% 70% 6% 13 Start Week 5 12 343 72% 62% 21% 14 Start Week 4 7 149 58% 78% 8% 15 Start Week 3 72 1546 59% 72% 15% 16 Start Week 2 14 330 70% 71% 10% 17 Start Week 1 1040 20676 61% 74% 10%
100% 12 weeks 90% Fill and Success Rates by Section Duration 13 weeks 80% 7 weeks Fill Rate 8 weeks 16 weeks 70% 9 weeks 60% 14 weeks 50% 15 weeks 40% 40% 50% 60% 70% 80% 90% 100% Success Rate
ENGL, 2% EDUC, 2% MART, 2% FASH, 2% MGMT, 3% BUS. LEGL ACTG MEDA, 3% Percent of Late Start Sections by Program KINE, 3% ECE. ECON ART CRER, 3% CRER KINE MEDA ART, 3% BUS., 44% MGMT FASH MART ECON, 6% EDUC ENGL MATH ECE., 6% SOSC ACTG, 6% LEGL, 15%
ART MART 100% KINE Fill Rate and Success Rate by Program for Late Start Classes 90% CRER ENGL BUS. 80% MGMT ACTG Fill Rate 70% SOSC ECE. 60% ECON FASH MEDA LEGL 50% 40% 30% 30% 40% 50% 60% 70% 80% 90% 100% Success Rate
ART (12) MART (9) KINE (7) 100% ECE. (16) BUS. (16) Fill Rate and Success Rate by Program and Section Duration for Late Start Classes ECON (13) ECE. (7) KINE (8) 90% CRER (15) BUS. (8) BUS. (13) 80% BUS. (15) ACTG (7) MGMT (15) ACTG (16) 70% SOSC (14) Fill Rate ACTG (8) MEDA (13) MEDA (15) 60% ECON (16) FASH (16) BUS. (14) MEDA (14) 50% ECON (14) BUS. (7) ECE. (15) LEGL (15) 40% FASH (9) 30% EDUC (13) 20% 20% 30% 40% 50% 60% Success Rate 70% 80% 90% 100%
100% Fill Rate & Success Rate by Section Duration for Late Start Business Classes BUS. (16) 90% 80% BUS. (8) BUS. (13) Fill Rate 70% BUS. (15) 60% BUS. (14) 50% BUS. (7) 40% 40% 50% 60% 70% 80% 90% 100% Success Rate
7 weeks 8 weeks 13 weeks 14 weeks 15 weeks 16 weeks 17 weeks Business Courses Bus.- 100 Fill Rates 88% 75% 79% 80% 63% Success Rates 79% 55% 59% 64% 70% Withdraw Rates 15% 28% 23% 21% 16% Late Start vs. Full Term Bus.- 103 Fill Rates 65% 63% 60% 106% 36% Success Rates 72% 82% 86% 78% 88% Withdraw Rates 0% 5% 4% 5% 8% Bus.- 201 Fill Rates 38% 90% 53% 63% 89% 45% Success Rates 33% 61% 71% 68% 87% 74% Withdraw Rates 40% 28% 19% 26% 3% 15%
Difficult to determine what the sweet spot is for course duration Success rates tend to increase as the duration of the course increases Conclusions Fill rates are inconsistent most late start classes were online with large section caps Students enrolled in late start sections, particularly evening sections, tend to be older than students enrolled in full term sections


")