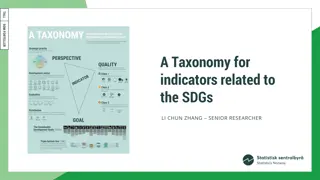
Latest Updates on EIOPA and EBA Taxonomies
In the recent releases of EIOPA and EBA taxonomies, version 2.4 brings harmonized error messages and improved controls. Version 2.5 introduces Brexit-related changes, while EBA version 2.9 addresses known errors and quality improvements. Stay informed about upcoming changes like the Big Review 2020 and the evolution of validation mechanisms. Explore the detailed evolution of taxonomies and be prepared for future modifications.

Download Presentation

Please find below an Image/Link to download the presentation.
The content on the website is provided AS IS for your information and personal use only. It may not be sold, licensed, or shared on other websites without obtaining consent from the author.If you encounter any issues during the download, it is possible that the publisher has removed the file from their server.
You are allowed to download the files provided on this website for personal or commercial use, subject to the condition that they are used lawfully. All files are the property of their respective owners.
The content on the website is provided AS IS for your information and personal use only. It may not be sold, licensed, or shared on other websites without obtaining consent from the author.
E N D
Presentation Transcript
Chapter 05 The Risk and Term Structure of Interest Rates (Sources and causes of fluctuations in interest rates relative to one another and look at a number of theories that explain these fluctuations)
Learning Objectives Identify and explain three factors explaining the risk structure of interest rates. List and explain the three theories of why interest rates vary across maturities.
Risk Structure of Interest Rates (1 of 3) Bonds with the same maturity have different interest rates due to: Default risk Liquidity Tax considerations
Figure 1 Long-Term Bond Yields, 19192017 Sources: Board of Governors of the Federal Reserve System, Banking and Monetary Statistics, 1941 1970; Federal Reserve Bank of St. Louis FRED database: http://research.stlouisfed.org/fred2
Risk Structure of Interest Rates (2 of 3) Default risk: probability that the issuer of the bond is unable or unwilling to make interest payments or pay off the face value U.S. Treasury bonds are considered default free (government can raise taxes). Risk premium: the spread between the interest rates on bonds with default risk and the interest rates on (same maturity) Treasury bonds
Figure 2 Response to an Increase in Default Risk on Corporate Bonds
Table 1 Bond Ratings by Moodys, Standard and Poor s, and Fitch (1 of 2) Rating Agency S&P Fitch Definitions Moody s Aaa AAA AAA Prime Maximum Safety Aa1 AA+ AA+ High Grade High Quality Aa2 AA AA Blank Aa3 AA AA Blank A1 A+ A+ Upper Medium Grade A2 A A Blank A3 A A Blank Baa1 BBB+ BBB+ Lower Medium Grade Baa2 BBB BBB Blank Baa3 BBB BBB Blank Ba1 BB+ BB+ Noninvestment Grade
Table 1 Bond Ratings by Moodys, Standard and Poor s, and Fitch (2 of 2) Rating Agency S&P Fitch Definitions Moody s Ba2 BB BB Speculative Ba3 BB BB Blank B1 B+ B+ Highly Speculative B2 B B Blank B3 B B Blank Caa1 CCC+ CCC Substantial Risk Caa2 CCC In Poor Standing Caa3 CCC Blank Ca Extremely Speculative C May Be in Default D Default
The Global Financial Crisis and the Baa Treasury Spread Starting in August 2007, the collapse of the subprime mortgage market led to large losses among financial institutions. As a consequence, many investors began to doubt the financial health of corporations with low credit ratings such as Baa and even the reliability of the ratings themselves. The perceived increase in default risk for Baa bonds made them less desirable at any given price.
Risk Structure of Interest Rates (3 of 3) Liquidity: the relative ease with which an asset can be converted into cash Cost of selling a bond Number of buyers/sellers in a bond market Income tax considerations Interest payments on municipal bonds are exempt from federal income taxes.
Figure 3 Interest Rates on Municipal and Treasury Bonds
Effects of the Obama Tax Increase on Bond Interest Rates In 2013, Congress approved legislation favored by the Obama administration to increase the income tax rate on high-income taxpayers from 35% to 39%. Consistent with supply and demand analysis, the increase in income tax rates for wealthy people helped to lower the interest rates on municipal bonds relative to the interest rate on Treasury bonds.
Term Structure of Interest Rates (1 of 4) Bonds with identical risk, liquidity, and tax characteristics may have different interest rates because the time remaining to maturity is different
Figure 4 Movements over Time of Interest Rates on U.S. Government Bonds with Different Maturities Sources: Federal Reserve Bank of St. Louis FRED database: http://research.stlouisfed.org/fred2/
Term Structure of Interest Rates (2 of 4) Yield curve: a plot of the yield on bonds with differing terms to maturity but the same risk, liquidity, and tax considerations Upward-sloping: long-term rates are above short-term rates Flat: short- and long-term rates are the same Inverted: long-term rates are below short-term rates
Term Structure of Interest Rates (3 of 4) The theory of the term structure of interest rates must explain the following facts: 1. Interest rates on bonds of different maturities move together over time. 2. When short-term interest rates are low, yield curves are more likely to have an upward slope; when short- term rates are high, yield curves are more likely to slope downward and be inverted. 3. Yield curves almost always slope upward.
Term Structure of Interest Rates (4 of 4) Three theories to explain the three facts: 1. Expectations theory explains the first two facts but not the third. 2. Segmented markets theory explains the third fact but not the first two. 3. Liquidity premium theory combines the two theories to explain all three facts.
Expectations Theory (1 of 7) The interest rate on a long-term bond will equal an average of the short-term interest rates that people expect to occur over the life of the long-term bond. Buyers of bonds do not prefer bonds of one maturity over another; they will not hold any quantity of a bond if its expected return is less than that of another bond with a different maturity. Bond holders consider bonds with different maturities to be perfect substitutes.
Expectations Theory (2 of 7) An example: Let the current rate on one-year bond be 6%. You expect the interest rate on a one-year bond to be 8% next year. Then the expected return for buying two one-year bonds averages (6% + 8%)/2 = 7%. The interest rate on a two-year bond must be 7% for you to be willing to purchase it.
Expectations Theory (3 of 7) For an investment of $1 = today's interest rate on a one-period bond i t e t = interest rate on a one-period bond expected for next period = today's interest rate on the two-period bond t i i + 1 2
Expectations Theory (4 of 7) Expected return over the two periods from investing $1 in the two-period bond and holding it for the two periods (1 + )(1 + ) 1 t i i = + + = + i 2 2 t 2 1 2 ( ) i 1 2 2 t t 2 2 ( ) i i 2 2 t t 2 Since ( ) is very small t i turn for holding the two-period bond for two periods is 2 2 the expected re ti 2
Expectations Theory (5 of 7) If two one-period bonds are bought with the $1 investment (1 )(1 t i i i + + + + + + + + ) 1 e t i + 1 ) 1 e t e t 1 ( i i + 1 1 t t e t e t ( ) i i i i + + 1 1 t t e t ( ) is extremely small Simplifying we get + i i + 1 t e t i i + 1 t
Expectations Theory (6 of 7) Both bonds will be held only if the expected returns are equal 2 t i i i i = = + e t i + 2 1 t + e t i + 1 t 2 t 2 The two-period rate must equal the average of the two one-period rates For bonds with longer maturities + = + + + e e t e t ... i i i i + + + 1 2 ( 1) t t n i nt n The -period interest rate equals the average of the one-period interest rates expected to occur over the -period life of the bond n n
Expectations Theory (7 of 7) Expectations theory explains: Why the term structure of interest rates changes at different times. Why interest rates on bonds with different maturities move together over time (fact 1). Why yield curves tend to slope up when short-term rates are low and slope down when short-term rates are high (fact 2). Cannot explain why yield curves usually slope upward (fact 3)
Segmented Markets Theory Bonds of different maturities are not substitutes at all. The interest rate for each bond with a different maturity is determined by the demand for and supply of that bond. Investors have preferences for bonds of one maturity over another. If investors generally prefer bonds with shorter maturities that have less interest-rate risk, then this explains why yield curves usually slope upward (fact 3).
Liquidity Premium & Preferred Habitat Theories (1 of 2) The interest rate on a long-term bond will equal an average of short-term interest rates expected to occur over the life of the long-term bond plus a liquidity premium that responds to supply and demand conditions for that bond. Bonds of different maturities are partial (not perfect) substitutes.
Liquidity Premium Theory int=it+it+1 e+it+2 e+...+it+(n 1) n e +lnt where lnt is the liquidity premium for the n-period bond at time t lnt is always positive Rises with the term to maturity
Preferred Habitat Theory Investors have a preference for bonds of one maturity over another. They will be willing to buy bonds of different maturities only if they earn a somewhat higher expected return. Investors are likely to prefer short-term bonds over longer- term bonds.
Figure 5 The Relationship Between the Liquidity Premium (Preferred Habitat) and Expectations Theory
Liquidity Premium & Preferred Habitat Theories (2 of 2) Interest rates on different maturity bonds move together over time; explained by the first term in the equation Yield curves tend to slope upward when short-term rates are low and to be inverted when short-term rates are high; explained by the liquidity premium term in the first case and by a low expected average in the second case Yield curves typically slope upward; explained by a larger liquidity premium as the term to maturity lengthens
Figure 6 Yield Curves and the Markets Expectations of Future Short-Term Interest Rates According to the Liquidity Premium (Preferred Habitat) Theory


")

")


")


")

")
")
")
")
")
")
")
")
")
")