Leading in Times of Uncertainty: A Strategy Toolkit for Social Impact Leaders
Utilize this comprehensive strategy toolkit to navigate challenging times by assessing, prioritizing, and implementing new approaches for social impact. From PESTLE analysis to continuous process improvement, empower your organization to thrive amidst uncertainty.
Uploaded on | 4 Views
Download Presentation

Please find below an Image/Link to download the presentation.
The content on the website is provided AS IS for your information and personal use only. It may not be sold, licensed, or shared on other websites without obtaining consent from the author. If you encounter any issues during the download, it is possible that the publisher has removed the file from their server.
You are allowed to download the files provided on this website for personal or commercial use, subject to the condition that they are used lawfully. All files are the property of their respective owners.
The content on the website is provided AS IS for your information and personal use only. It may not be sold, licensed, or shared on other websites without obtaining consent from the author.
E N D
Presentation Transcript
Leading in Times of Uncertainty A Strategy Toolkit for Social Impact Leaders ILE Strategies Ilestrategies.com
Dear Nonprofit Leaders, Use these tools to assess, prioritize, implement and evaluate new approaches in fulfilling your mission. The global pandemic, social unrest, war in Ukraine and looming recession made us realize how unpredictable the world is. Many organizations have been challenged by delays and shortfalls in their programs and services in due to staffing challenges, supply shortages or rising energy costs. Our clients have used these when they need a quick plan to resolve sudden gaps in their programs or cost increases. Others have used these tools to help communicate with key stakeholders who may be impacted by your new plan. So, what do leaders do in times of uncertainty? How do you stay focused on your mission with constant disruption? We have a fillable, editable and sharable version of this toolkit in PowerPoint, which can be exported as a PDF and shared with stakeholders, email me at anasa@ilestrategies.com for a copy. In a recent blog post, Roger Martin, leading business management thought leader and author, describes the need for regularly revisiting your organizational strategy and implementation processes during times of uncertainty. I hope this toolkit comes in handy. Please contact me with your feedback. Thanks, Anasa Laude, Managing Director This toolkit includes templates that we have designed based on common strategy and planning concepts namely, PESTLE analysis, (Kaizen) Continuous Process Improvement and OKRs. 2
Contents How to Use This Toolkit (pg 4) PESTLE Analysis Template (pg 5) Strategic Planning Framework (pg 7) Objectives and Key Results Templates (pg 9) Process Improvement Framework (pg 12) Process Improvement PICK Chart (pg 14) Process Improvement Report Canvas (pg 16) 3
How to Use This Toolkit How to Use This Toolkit Whether you lead a social venture, a nonprofit or even a small family enterprise this toolkit will help focus on aligning your operations and service model to external impacts while ensuring continued success. For further reference read Strategic Tools for Social Entrepreneurs by J. Gregory Dees. Assess external macro level issues influencing your organization. Revisit / realign your strategic plan. Assign roles for action planning. Report process improvement outcomes. Pg. 16 Process Improvement Report Prioritize incremental process change. Evaluate internal processes. Pg. 12 Process Improvement Framework Pg. 9 Objectives and Key Results Pg. 7 Strategic Planning Framework Pg. 5 PESTLE Analysis Pg. 14 PICK Chart 4
PESTLE Analysis Template PESTLE analysis is an audit of external factors that influences an organization. Use this PESTLE analysis to gain an understanding of political, economic, social, technological, legal and environmental factors that might impact your organization. 5
List issues related to elections, regulatory issues, public funding and infrastructure that may impact your organization and activities. List political issues here: 1. 2. 3. List Political Opportunities here: 1. 2. 3. List Political Risks here: 1. 2. 3. P Political List factors such as inflation, economic growth and unemployment rates. List economic factors here: 1. 2. 3. List Economic Opportunities here: 1. 2. 3. List Economic Risks here: 1. 2. 3. E Economic List cultural issues, trends in public discourse and demographic issues. List social trends here: 1. 2. 3. List Social Opportunities here: 1. 2. 3. List Social Risks here: 1. 2. 3. S Social List technology, data and Artificial Intelligence access, barriers and risks. List technological advantages and challenges here: 1. 2. 3. List Tech Opportunities here: 1. 2. 3. List Tech Risks here: 1. 2. 3. T Technological List contractual, regulatory, labor, health and safety considerations. List legal responsibilities / risks here: 1. 2. 3. List Legal Opportunities here: 1. 2. 3. List Legal Risks here: 1. 2. 3. L Legal List impact of climate change, and impact of your activities on the environment. List environmental factors / issues here: 1. 2. 3. List Environmental Opportunities here: 1. 2. 3. List Environmental Risks here: 1. 2. 3. E Environmental 6
Strategic Planning Framework Whether conducting strategic planning in-house with staff or engaging a facilitator, use these guiding questions to prepare your team. The answers to each question should be relevant, concise and focused. 7
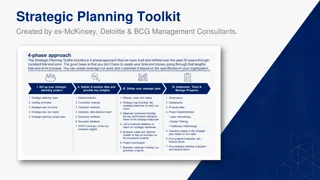
Strategic Planning Framework 10 Questions What is our theory of change? Who are our key stakeholders? What are our mission and vision? What is our unique value proposition? What objectives are required to achieve our mission? How will we measure results? Strategic Planning Framework What will be our outreach plan? What are the economics of our operations and programs? What programs and services do we offer? What are the capital requirements to successfully launch/scale new programs? What demographic are we serving? 8
OKRs- Templates OKR, which stands for Objectives and Key Results, is a planning and goal setting technique popularized by Intel and Google. Created by business guru Peter Drucker and popularized by Andy Grove, founder of Intel OKRs represent goals and define the measurable steps you'll take towards achieving those goals. They're typically used to set short-term goals but can also be used for annual planning. For small organizations, with less than 250 employees, a simple form that is updated regularly with key metrics entered manually can work just fine. . I ve recreated one as a PowerPoint slide to make it user-friendly, easy to edit, fill and share. Save them as PDFs to share with board members, community advisory groups and other stakeholders. Tips for Preparing to use OKRs 1. Shoot for the stars and land on the moon. - Goals should be very ambitious, yet achievable. The idea is to push yourself and your team in reaching new heights and propelling the organization forward. To keep very one motivated small wins along the way. 2. Use the OKR planning process to provide professional development opportunities a key driver of retention - to staff. 3. Involve the entire team in planning. Everyone's OKRs should be visible and accessible. 4. OKRs are part of action planning and should align with higher level organizational goals. 5. Use canvas and tables/ spreadsheets to track results. Use OKRs during meetings to facilitate progress reporting. 6. Use the OKR table, to list departmental or organizational objectives all in one place. Use the form on page 18 for individual assignments. We recommend you use both, to facilitate communication, accountability and transparency. For further references read Measure What Matters by John Doerr. 9
OKR Individual Canvas Objective Key Result 1 Key Result 2 Key Result 3 10
OKR Team Template Objective Key Result ( up to 3) Owner Team Progress Status What do you want to accomplish? How will you accomplish this objective in a way that is measurable? What is the name of the person who will implement/oversee these key results? Insert team or department of the Owner. Insert progress metrics to report. Include notes on opportunities and threats impacting outcomes thus far. 11
Process Improvement Framework On the next page is a process improvement framework that we have adapted based on our experience serving nonprofit teams. This is a spin on a business process improvement framework popularized by the manufacturing industry, namely Toyota. Process mapping sounds complex, but it doesn t have to be. If you are dealing with an urgent issue and need a timely, cost-effective solution a simple chart outlining key tasks and roles involved in a particular process. For further reference read Lean Kaizen: A Simplified Approach to Process Improvements by George Alukal or Gemba Kaizen A Common-sense, Low- Cost Approach to Management by Masaaki Imai. Suggested Use: You can white board your process or use low-cost online tools like MS Visio, which is intuitive and simple to use. As a team you can write down each step in the process, literally every single step, and then talk through the challenges at each step. It s important for all team members involved in this process to be present during the meeting. More than anything, process mapping is just a tool for facilitating team communication and information exchange which is the most important aspect of this exercise. Find Incremental Solutions Changes should be small and manageable. If the changes are too drastic, it can end up exacerbating the problem and contribute to more bottlenecks and could end up demoralize team members. Instead of targeting major shifts, find easy and no-cost / low-cost changes. Based on my experience the best incremental changes usually involve better communication, information exchange and clearer articulation of assignments and roles. Track and Frequently Evaluate Progress However, small the fix, success requires consistency and check ins. Even if the change includes a minor task such as a weekly email update, that task must be scheduled and tracked just as you would any other team role. Report Frequently Finally, use the Process Improvement Report Canvas as an overview of the process improvement effort and to keep all stakeholders informed.12
Process Improvement Framework Define the problem or opportunity. Collect data and information relevant to the problem. Conduct an analyses of solutions to date. Define success metrics . 1. Plan Pilot a solutions on a small scale. Track data based on success metrics during the pilot. 4. 2. Act Do Implement solution at a larger scale. Continuously test and adjust solution as needed. 3. Analyze the results of the pilot. Assess feasibility and scalability of solution. Check 13
PICK Chart for Prioritizing Process Improvement Suggested use: Use the PICK Chart to prioritize new initiatives for process or program improvement. The PICK chart, which is an acronym for Possible, Implement, Challenge and Kill will help you rank each idea based on the payoff and the possibility of implementation. 14
Process Improvement PICK Chart 1. 2. 3. 1. 2. 3. Tip: Double click inside each box to insert ideas based on level of difficulty and payoff. 1. 2. 3. 1. 2. 3. 15
Process Improvement Report Canvas Suggested use: The Process Improvement Report Canvas is helpful for visualizing incremental revisions to your processes. The canvas will provide key stakeholders with an overview of the of the problem, solutions and metrics or data you plan to use to guide decisions and evaluate results. Use this template to create a simple report post project implementation. Export as a PDF to share with clients, staff, board and key stakeholders, to display online and in print at key locations. Create multiple reports for each problem addressed. Repeat the process every 1-3 months to sustain continuous improvement of operations and programs. Use ten words or less per section. Use simple graphs in the large boxes to illustrate before and after scenarios. Use the boxes on the right to check off each issue addressed during this process. 16
Process Improvement Report Issues Addressed Problem Solution Data Source Improve client outcomes Improved communication Improve stakeholder engagement Increased funding Before After Improve compliance (insert image or graph) (insert image or graph) Improve safety Improve clarity Reduce costs Reduce disruption Reduce bureaucracy Reduce Redundancy 17
Working on a new strategy with your team? Access other helpful content at ilestrategies.com Stay in touch via email: anasa@ilestrategies.com 18

