Analysis of target populations in South Tyneside requiring social care support, including demographics, client breakdowns, and projected growth. Data on various health conditions and services provided by the local authority are also outlined.
Please find below an Image/Link to download the presentation.
The content on the website is provided AS IS for your information and personal use only. It may not be sold, licensed, or shared on other websites without obtaining consent from the author. If you encounter any issues during the download, it is possible that the publisher has removed the file from their server.
You are allowed to download the files provided on this website for personal or commercial use, subject to the condition that they are used lawfully. All files are the property of their respective owners.
The content on the website is provided AS IS for your information and personal use only. It may not be sold, licensed, or shared on other websites without obtaining consent from the author.
E N D
Presentation Transcript
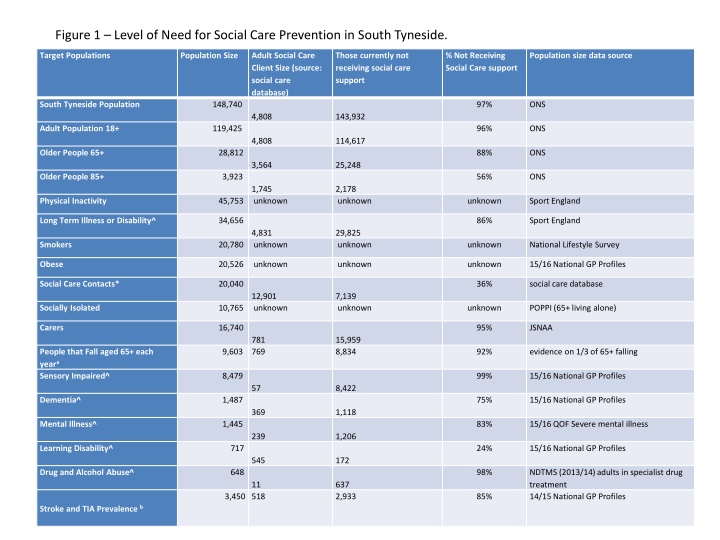
Figure 1 Level of Need for Social Care Prevention in South Tyneside. Target Populations Population Size Adult Social Care Client Size (source: social care database) Those currently not receiving social care support % Not Receiving Social Care support Population size data source South Tyneside Population 148,740 97% ONS 4,808 143,932 Adult Population 18+ 119,425 96% ONS 4,808 114,617 Older People 65+ 28,812 88% ONS 3,564 25,248 Older People 85+ 3,923 56% ONS 1,745 2,178 unknown Physical Inactivity 45,753 unknown unknown Sport England Long Term Illness or Disability^ 34,656 86% Sport England 4,831 29,825 unknown Smokers 20,780 unknown unknown National Lifestyle Survey Obese 20,526 unknown unknown unknown 15/16 National GP Profiles Social Care Contacts* 20,040 36% social care database 12,901 7,139 unknown Socially Isolated 10,765 unknown unknown POPPI (65+ living alone) Carers 16,740 95% JSNAA 781 15,959 8,834 People that Fall aged 65+ each yeara Sensory Impaired^ 9,603 769 92% evidence on 1/3 of 65+ falling 8,479 99% 15/16 National GP Profiles 57 8,422 Dementia^ 1,487 75% 15/16 National GP Profiles 369 1,118 Mental Illness^ 1,445 83% 15/16 QOF Severe mental illness 239 1,206 Learning Disability^ 717 24% 15/16 National GP Profiles 545 172 Drug and Alcohol Abuse^ 648 98% NDTMS (2013/14) adults in specialist drug treatment 14/15 National GP Profiles 11 637 2,933 3,450 518 85% Stroke and TIA Prevalence b
Figure 5 Community Assets commissioned by the local authority Provider Service Age Concern Tyneside South Integrated wellbeing service for older people Alzheimer's Society Day service for older people with dementia Apna Ghar BME outreach service Arts 4 Wellbeing Arts based day service for adults with learning disabilities Bliss=Ability Carers advocacy Bliss=Ability Advocacy spot contract Bliss=Ability Self care Bliss=Ability Healthnet Lifeline Adult carers service Churches Together Happy at Home befriending service Citizen's Advice Bureau Advice service CVS Voluntary sector infrastructure Groundwork Green exercise Healthwatch South Tyneside Local Healthwatch Carers Federation Regional NHS Complaints Advocacy Mental Health Concern Mental health day services Places for People Women's refuge Relate (N'land and Tyneside) Relationship counselling Sunderland Samaritans Support to people experiencing suicidal feelings or who are depressed or anxious Sight Service Sight/hearing advice and support. South Tyneside Talking Newspapers Ass. Supplying talking newspapers to people with visual impairment Speech After Stroke Club After- stroke support services South Tyneside Arab/Muslim Community Service Support to the Arab and Muslim community Washington MIND Emotional health and wellbeing WHIST Women's health and wellbeing services Your Voice Counts Independent Mental Capacity Advocate.
Figure 6 Types of Intervention Condition/Behaviour Intervention Target Groups Quality of Evidence/Effectiveness of targeted interventions Currently provided locally Risk to SC Duration to impact Tobacco use Smoking Services Smokers High quality evidence. NICE shows that all the interventions studied are cost-effective when compared with no intervention or BA . Interventions that have a low cost and a low cessation rate dominate no intervention . Interventions with a higher cost and high cessation rate dominate no intervention . The cost per QALY of each of the interventions was low, when compared to no intervention. This supports the position as shown in other papers. Smoking cessation provided locally coordinated through public health Change 4 Life Programme Smokers twice as likely to need social care support (ASH) Short and Long Term Physical Inactivity Physical inactivity Inactive in ST Strong evidence that physical activity prevents or manages many long term conditions however evidence lacking in terms of interventions that increase community wide physical activity Exercise referral offered through Change4Life High Long Term Obesity Obesity Overweight and Obese No evidence for effective interventions. Strong evidence of obesity increasing risk of many long term conditions however evidence around effective interventions is lacking. Limited local offer Long Term Risk of falling Falls Prevention Older People High Quality. Number of interventions under falls with varying effectiveness. Group Exercise - Significantly reduces rate of falls and risk of falls Multifactorial interventions which include risk assessment reduced rate of falls but not risk falling Vitamin D interventions did not reduce either risk or rate of falling Home Safety assessment effective in reducing both rate and risk of falling, more effective in those at higher risk Withdrawal of psychotropic medication reduced rate of falls but not risk of falling Education interventions did not reduce risk or rate of falls. Falls service within hospital but decommissioned community falls pathway at Age UK 20% of hip fractures result in a social care placement. There are 200 hip fractures/year in ST, 170 new residential placements a year and 80 new nursing placements a year. This means roughly 16% of new placements are due to hip fracture Short Term Risk of Stroke Stroke Prevention Those with AF, smokers, previous stroke High quality. Risk-reduction measures in primary stroke prevention include the use of antihypertensive medications, anticoagulants, platelet antiaggregants, reductase inhibitors (statins), smoking cessation, dietary intervention, weight loss, and exercise. AF identification in primary care Medium Medium Social Isolation Local Area Coordination socially isolated, frequent flyers Very low quality evidence for Local Area Coordination. Locally produced evaluations elsewhere in England show a 4 social return on investment; however no available peer reviewed published research. Medium Short to Medium Term Immediate risk of residential care Reablement At risk of residential care Low quality evidence for reablement. Cochrane review found no evidence to support the effectiveness of reablement of up to 12 weeks. The review has acknowledged that the quality of evidence is very low and that there may be some small positive effects. Reablement based home care packages were compared against usual home-care provision. Mortality, quality of life, likelihood of transferring to residential care, and cost effectiveness were all considered. 6-week reablement offered locally High Short Term


")