Levels of Software Design Process
The software design process involves three levels - Architectural Design, High-level Design, and Detailed Design. Each level focuses on different aspects of transforming user requirements into a suitable form for software coding and implementation.

Download Presentation

Please find below an Image/Link to download the presentation.
The content on the website is provided AS IS for your information and personal use only. It may not be sold, licensed, or shared on other websites without obtaining consent from the author. If you encounter any issues during the download, it is possible that the publisher has removed the file from their server.
You are allowed to download the files provided on this website for personal or commercial use, subject to the condition that they are used lawfully. All files are the property of their respective owners.
The content on the website is provided AS IS for your information and personal use only. It may not be sold, licensed, or shared on other websites without obtaining consent from the author.
E N D
Presentation Transcript
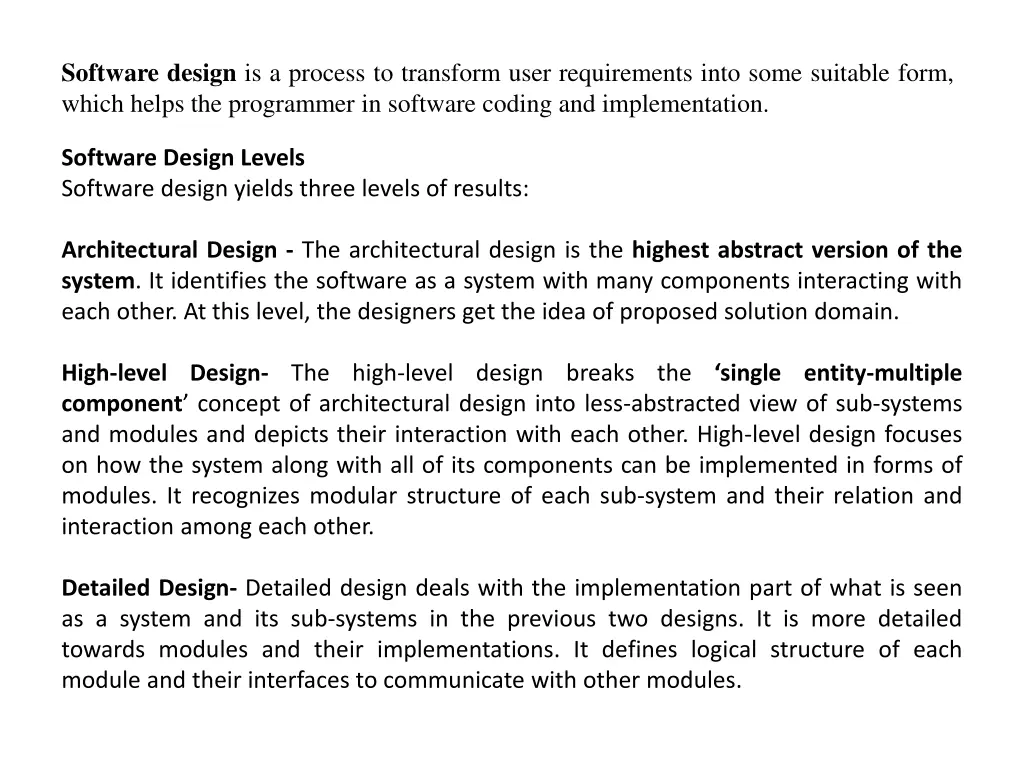
Software design is a process to transform user requirements into some suitable form, which helps the programmer in software coding and implementation. Software Design Levels Software design yields three levels of results: Architectural Design - The architectural design is the highest abstract version of the system. It identifies the software as a system with many components interacting with each other. At this level, the designers get the idea of proposed solution domain. High-level Design- The high-level design breaks the single entity-multiple component concept of architectural design into less-abstracted view of sub-systems and modules and depicts their interaction with each other. High-level design focuses on how the system along with all of its components can be implemented in forms of modules. It recognizes modular structure of each sub-system and their relation and interaction among each other. Detailed Design- Detailed design deals with the implementation part of what is seen as a system and its sub-systems in the previous two designs. It is more detailed towards modules and their implementations. It defines logical structure of each module and their interfaces to communicate with other modules.
Coupling and Cohesion When a software program is modularized, its tasks are divided into several modules based on some characteristics. As we know, modules are set of instructions put together in order to achieve some tasks. They are though, considered as single entity but may refer to each other to work together. There are measures by which the quality of a design of modules and their interaction among them can be measured. These measures are called coupling and cohesion. Cohesion : grouping of all functionally related elements. Cohesion is a measure that defines the degree of intra-dependability within elements of a module. The greater the cohesion, the better is the program design. Coupling : communication between different modules. Coupling is a measure that defines the level of inter-dependability among modules of a program. It tells at what level the modules interfere and interact with each other. The lower the coupling, the better the program.
Function Oriented Design In function-oriented design, the system is comprised of many smaller sub-systems known as functions. These functions are capable of performing significant task in the system. The system is considered as top view of all functions. This design mechanism divides the whole system into smaller functions, which provides means of abstraction by concealing the information and their operation. These functional modules can share information among themselves by means of information passing and using information available globally. Another characteristic of functions is that when a program calls a function, the function changes the state of the program, which sometimes is not acceptable by other modules. Design Process The whole system is seen as how data flows in the system by means of data flow diagram. DFD depicts how functions changes data and state of entire system. The entire system is logically broken down into smaller units known as functions on the basis of their operation in the system. Each function is then described at large.
Object Oriented Design Object oriented design works around the entities and their characteristics instead of functions involved in the software system. This design strategies focuses on entities and its characteristics. Objects - an In stance of the class Classes - A class is a generalized description of an object. An object is an instance of a class. Class defines all the attributes, which an object can have and methods, which defines the functionality of the object. Encapsulation - In OOD, the attributes (data variables) and methods (operation on the data) are bundled together is called encapsulation. Encapsulation not only bundles important information of an object together, but also restricts access of the data and methods from the outside world. This is called information hiding. Inheritance - OOD allows similar classes to stack up in hierarchical manner where the lower or sub-classes can import, implement and re-use allowed variables and methods from their immediate super classes. This property of OOD is known as inheritance. This makes it easier to define specific class and to create generalized classes from specific ones. Polymorphism - OOD languages provide a mechanism where methods performing similar tasks but vary in arguments, can be assigned same name. This is called polymorphism, which allows a single interface performing tasks for different types. Depending upon how the function is invoked, respective portion of the code gets executed.
Verification for Design can be defined as a method of confirmation by examining and providing evidence that the design output meets the design input specifications. An essential process during any product development that ensures the designed product is same as the intended use. Design input is any physical and performance requirement that is used as the basis for designing purpose. Design output is the result of each design phase and at the end of total design effort. The final design output is a basis for device master record. Key Points for Design Verification Design verification is used where the actual design output should be same as expected design output which satisfies the specifications of the product. Design Verification ask: Did you design the product right? Design verification includes unit and primary integration level testing. Design verification can be conducted on the individual module or on the completed system under any conditions.
Software Metrics Objectives Introduce the necessity for software metrics Differentiate between process, project and product metrics Compare and contrast Lines-Of-Code (LOC) and Function Point (FP) metrics Consider how quality is measured in Software Engineering
Terminology Measure: Quantitative indication of the extent, amount, dimension, or size of some attribute of a product or process. A single data point Metrics: The degree to which a system, component, or process possesses a given attribute. Relates several measures (e.g. average number of errors found per person hour) Indicators: A combination of metrics that provides insight into the software process, project or product Direct Metrics: Immediately measurable attributes (e.g. line of code, execution speed, defects reported) Indirect Metrics: Aspects that are not immediately quantifiable (e.g. functionality, quantity, reliability) Faults: Errors: Faults found by the practitioners during software development Defects: Faults found by the customers after release
Normalization for Metrics Depend on the size and complexity of the project Normalization: compensate for complexity aspects particular to a product Normalization approaches: Size oriented (lines of code approach) Function oriented (function point approach)
Typical Normalized Metrics Project LOC FP Effort (P/M) doc alpha 12100 189 24 Pp. Errors Defect People s 365 134 29 3 beta 27200 388 62 1224 321 86 5 gamma 20200 631 43 1050 256 64 6 Size-Oriented: errors per KLOC (thousand lines of code), defects per KLOC, R per LOC, page of documentation per KLOC, errors / person-month, LOC per person-month Function-Oriented: errors per FP, defects per FP, pages of documentation per FP, FP per person-month
Computing Function Points Analyze information domain of the application and develop counts Establish count for input domain and system interfaces Assign level of complexity (simple, average, complex) or weight to each count Weight each count by assessing complexity Assess the influence of global factors that affect the application Grade significance of external factors, F_i, such as reuse, concurrency, OS, ... FP = SUM(count x weight) x C where complexity multiplier C = (0.65+0.01 x N) degree of influence N = SUM(F_i) Compute function points
Analyzing the Information Domain weighting factor simple avg. complex count measurement parameter number of user inputs number of user outputs number of user inquiries number of files number of ext.interfaces count-total X X X X X 3 4 3 7 5 4 5 4 10 7 6 7 6 15 10 = = = = = complexity multiplier function points
Taking Complexity into Account Complexity Adjustment Values (F_i) are rated on a scale of 0 (not important) to 5 (very important): 1. Does the system require reliable backup and recovery? 2. Are data communications required? 3. Are there distributed processing functions? 4. Is performance critical? 5. System to be run in an existing, heavily utilized environment? 6. Does the system require on-line data entry? 7. On-line entry requires input over multiple screens or operations? 8. Are the master files updated on-line? 9. Are the inputs, outputs, files, or inquiries complex? 10. Is the internal processing complex? 11. Is the code designed to be reusable? 12. Are conversion and instillation included in the design? 13. Multiple installations in different organizations? 14. Is the application designed to facilitate change and ease-of-use?
Exercise: Function Points Compute the function point value for a project with the following information domain characteristics: Number of user inputs: 32 Number of user outputs: 60 Number of user enquiries: 24 Number of files: 8 Number of external interfaces: 2 Assume that weights are average and external complexity adjustment values are not important. Answer: 24 5 60 4 32 ( + + + + ) 7 . 0 = 4 8 10 2 65 401 7 .
Example: SafeHome Functionality Test Sensor Password Sensors Zone Setting Zone Inquiry SafeHome System Messages Sensor Inquiry User User Sensor Status Panic Button (De)activate (De)activate Monitor and Response System Password, Sensors, etc. Alarm Alert System Config Data
Example: SafeHome FP Calc weighting factor simple avg. complex count measurement parameter number of user inputs X 3 4 6 = 9 3 number of user outputs X 4 5 7 = 8 2 number of user inquiries X 3 4 6 = 2 6 number of files 1 7 X 7 10 15 = 20 number of ext.interfaces count-total X 5 7 10 = 4 52 + . 0 [ = + . 0 [ 65 . 0 01 ] 65 . 0 46 ] iF complexity multiplier 1.11 function points 58
OO Metrics: Distinguishing Characteristics The following characteristics require that special OO metrics be developed: Encapsulation Concentrate on classes rather than functions Information hiding An information hiding metric will provide an indication of quality Inheritance A pivotal indication of complexity Abstraction Metrics need to measure a class at different levels of abstraction and from different viewpoints Conclusion: the class is the fundamental unit of measurement
OO Project Metrics Number of Scenario Scripts (Use Cases): Number of use-cases is directly proportional the number of classes needed to meet requirements A strong indicator of program size Number of Key Classes (Class Diagram): A key class focuses directly on the problem domain NOT likely to be implemented via reuse Typically 20-40% of all classes are key, the rest support infrastructure (e.g. GUI, communications, databases) Number of Subsystems (Package Diagram): Provides insight into resource allocation, scheduling for parallel development and overall integration effort
OO Analysis and Design Metrics Related to Analysis and Design Principles Complexity: Weighted Methods per Class (WMC): Assume that n methods with cyclomatic complexity are defined for a class C: , ,..., c c nc 1 2 = WMC ic Depth of the Inheritance Tree (DIT): The maximum length from a leaf to the root of the tree. Large DIT leads to greater design complexity but promotes reuse Number of Children (NOC): Total number of children for each class. Large NOC may dilute abstraction and increase testing
Project Planning sw project management process begins with project planning objective of sw project planning - to provide a framework for manager to make reasonable estimates of resources, costs and schedules
project estimation first step in project planning estimate resources, cost, and schedule for sw development project requires experience and access to historical information
project estimation estimation is risky business - lots of uncertainty due to: project complexity project size degree of structural uncertainty - degree to which requirements are solidified availability of historical information risk - measured by degree of uncertainty in quantitative estimates
project estimation evolutionary process models - iterative view of development possible to revise the estimate estimates made at beginning of sw project should be updated regularly estimates should define best case and worst case
Activities associated with project planning Software scope resources project estimation decomposition
1. software scope want to establish a project scope that is unambiguous and understandable at management and technical levels describes: function performance constraints interfaces reliability
2. resources must estimate resources required to accomplish the development effort
a. hw and sw tools foundation of resources pyramid, provides infrastructure to support development sw engineering environment must prescribe the time-frame required for hw and sw verify that these resources will be available
b. reusable sw components next level, can reduce development costs reuse considerations often ignored can greatly reduce development time
c. people - top of pyramid select skills needed
each resource specified with 4 characteristics 1. description of resource 2. statement of availability 3. chronological time resource will be needed 4. duration of time resource used
Make / Buy Decision Reasons for Making There are number of reasons a company would consider when it comes to making in-house. Following are a few: Cost concerns Desire to expand the manufacturing focus Need of direct control over the product Intellectual property concerns Quality control concerns Supplier unreliability Lack of competent suppliers Volume too small to get a supplier attracted Reduction of logistic costs (shipping etc.) To maintain a backup source Political and environment reasons Organizational pride
Reasons for Buying Following are some of the reasons companies may consider when it comes to buying from a supplier: Lack of technical experience Supplier's expertise on the technical areas and the domain Cost considerations Need of small volume Insufficient capacity to produce in-house Brand preferences Strategic partnerships
The Process 1. Preparation Team creation and appointment of the team leader. Identifying the product requirements and analysis. Team briefing and aspect/area destitution 2. Data Collection Collecting information on various aspects of make-or-buy decision Workshops on weightings, ratings, and cost for both make-or-buy 3. Data Analysis Analysis of data gathered 4. Feedback Feedback on the decision made
Scheduling Principle Scheduling Principles Compartmentalization Define distinct tasks Interdependency Indicate task interrelationships Validation Be sure resources are available Defined Responsibilities People must be assigned Defined Outcomes Each task must have an output Defined Milestones Review for quality
Project Scheduling - Relationship between people and effort or a small project, requirements analysis, performing design, code generation and test conduction can be done by a single person but as the size of the project increases, more people get added. Adding people later in the project often has a disruptive effect on the project causing schedules to slip even further. If more people are added to a late project, be sure that you have assigned them work that is highly compartmentalized. The people who are added later in the project should know the system properly. In addition to the time that it takes to learn the system, it also increases the number and complexity of communication paths. Every communication path requires additional effort and time. Project schedules are elastic. It is possible to compress or extend a desired project completion date to some extent. If delivery can be delayed, it indicates that project costs can be reduced substantially. As the project deadline becomes tighter and tighter, you reach a point at which the work cannot be completed on schedule, regardless of the number of people doing the work. The reality should be faced and a new delivery date should be defined. Effort should also be distributed across the software process workflow. Recommended effort distribution is referred as 40-20-40 rule. Front end analysis and design and back end testing are allocated 40% of all effort while 20% of effort is allocated to coding. The characteristics of each project must dictate the distribution of effort. Effort on analysis or prototyping should increase in direct proportion with project size and complexity.
What is a Timeline Chart? A timeline chart is an effective way to visualize a process using chronological order. Since details are displayed graphically, important points in time can be easy seen and understood. Often used for managing a project s schedule, timeline charts function as a sort of calendar of events within a specific period of time. Gantt chart is a type of a bar chart that is used for illustrating project schedules. Gantt charts can be used in any projects that involve effort, resources, milestones and deliveries. Gantt charts allow project managers to track the progress of the entire project. Through Gantt charts, the project manager can keep a track of the individual tasks as well as of the overall project progression.