Leveraging Alternative Data for Financial Inclusion in Underserved Regions
Harnessing cellular usage data through AI can enable the inclusion of unbanked populations in essential financial services. By using predictive scoring models, this approach aims to empower marginalized communities and drive inclusive growth in developing regions.

Download Presentation

Please find below an Image/Link to download the presentation.
The content on the website is provided AS IS for your information and personal use only. It may not be sold, licensed, or shared on other websites without obtaining consent from the author.If you encounter any issues during the download, it is possible that the publisher has removed the file from their server.
You are allowed to download the files provided on this website for personal or commercial use, subject to the condition that they are used lawfully. All files are the property of their respective owners.
The content on the website is provided AS IS for your information and personal use only. It may not be sold, licensed, or shared on other websites without obtaining consent from the author.
E N D
Presentation Transcript
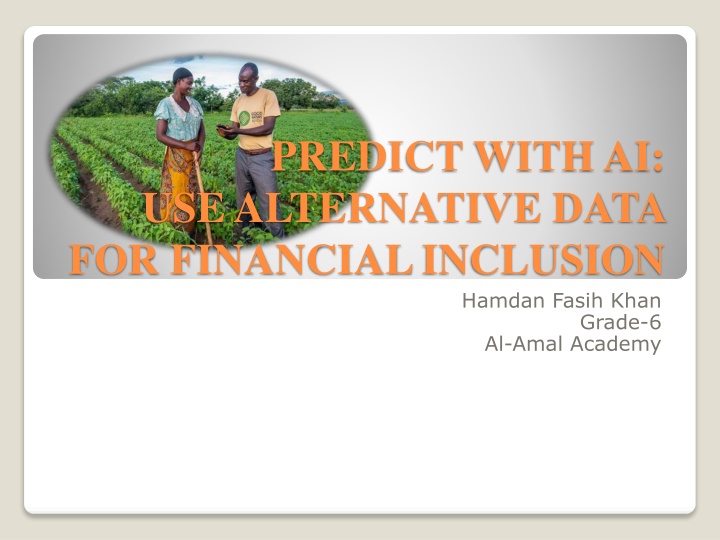
PREDICT WITH AI: USE ALTERNATIVE DATA FOR FINANCIAL INCLUSION Hamdan Fasih Khan Grade-6 Al-Amal Academy
The developing and under-developed regions of the world in South Asia and Sub-Saharan Africa account for more than 2 billion of the global population. Vast majority of the population living in these regions come from lower income groups and many live below the poverty line. Poor Segments or Bottom of the Pyramid populations (low income, poor and others living below poverty line) from the least developed regions lack access to credit, healthcare, insurance, financial services due to the poor quality of data available to governments and service providers otherwise common to the developed regions. Poor segments may include low income, rural and unemployed segments that hardly have an identity to be known in the national database, and services providers do not have a reference to establish trust or track such individuals to be able to grant them the service they desire. Access to services will require more data and information about the poor segments to allow governments and service providers to perform due diligence and enable them for access to basic financial services. Background
To be able to include the poor segments onto the information grid, artificial intelligence through advanced data analytics could prove advantageous if alternative data sources are leveraged to profile these segments and enable them for financial and other ancillary services to improve livelihood, such communities, and regions and achieve inclusive growth for governments and businesses in these regions. Problem Statement
Alternative data from cellular usage can be used to create an algorithm that will help classify good and bad segments of poor population that are un-banked and undocumented to enable them for basic financial services. Hypothesis
The predictive scoring model is developed using cellular data for post-paid over a period of three months (prototype data set) to evaluate the default behaviour of the post-paid subscribers. The idea is to develop an applicant scorecard using a wide range of mathematical tools and techniques that sifts through a large analytic data set looking for the most relevant variables that carry the highest information value for classification (good or bad). An analytical tool (Statistica) is used to deal with big data from cellular usage (arbitrary data set for this study) to analyse performance and classification power by fixing bias, variation, redundancy, outliers, missing values etc. Big data is noisy, unstructured, and dynamic rather than static. It may also be corrupted or incomplete. It requires a more sophisticated way to translate it into vectors. Model uses a wide range of mathematical tools and techniques to make sense of this data, including text recognition. It sifts through millions of rows (in the case of actual data) looking for the most relevant variables to whatever system it is trying to model. You may have a very simplistic model at the tiny local scale, but tool with machine learning methods lets you take a lot of simple models and integrate them into one big picture, analyze performance and classification power by fixing bias, variation, redundancy, outliers, missing values etc. Research Methodology
User Device e.g. Laptop Data Modeling Tool e.g. Excel, Statistica Data Modeling Techniques e.g. Regression, Boosting Trees, Neural Networks Data Set (Prototype Data Set of Telecom Consumer Base of a developing country) Microsoft Excel for Results and Reporting 1. 2. 3. 4. 5. Materials
Create a representative sample of cellular usage data (create a prototype data sample for this study) i.e. a set of variables about cell phone usage behavior as an alternative source of data point for this study Choose the target (dependent) variable (i.e. outcome/response) for the data set e.g. identifying those who are bad payers based on billing history e.g. for post-paid segment, flag if a customer is 2 month over due for payment Analyze the data for variables relationship with the target variable Select a predictive (artificial intelligence) analytics tool for the experiment Apply predictive analytics algorithm to determine the best classification predictors Select algorithm with the highest predictive value and lowest prediction error Import the data set into the predictive analytics tool and apply the predictive algorithm against the predictors or independent variables shortlisted above Evaluate the experiment results using advanced analytics and statistics Use a test data set to validate findings and model 1. 2. 3. 4. 5. 6. 7. 8. 9. Procedure
Dependent Variable = Probability of Default i.e. if an un-banked individual with a cell phone will fail on payments. Independent variables (refer the table below) will include a number of variables from voice, text, data, video be leveraging cellular usage e.g. number of outgoing calls during the day, number of incoming calls during the week, data downloads for the day/week/month etc. Controlled variable will include subscriber ID for the purpose of this arbitrary experiment. Variables
Data Collection and Transformation Sample selection from the population (select a representative sample based on average revenue per user) Extract Analytic Data Set Variables for calls, sms, data (e.g. average duration per month or average APRU with variants for usage in peak period, off-peak period, on network, off network etc.) Variables specifying activity, dormancy, status etc. Variables for billing history (e.g. last payment date - could be after bill generation date or before, no. of days payment is overdue etc.) Period: 3 consecutive months Apply Data Quality Checks Check for missing values/outliers Check for inconsistency among variables Create Modeling Data Set Define the target variable Day past due for the first and second month Create training and test samples (75% training, 25% test) Apply variable selection to select the best predictor class Correlation and causation effect Remove redundancy Modelling Approach
Best Predictors (Independent Variables) Average duration of overall active period Percentage of outgoing SMS off net Count of outgoing local calls No. of times that subscriber outgoing silent 20 days consecutively Sum of outgoing Minutes of Usage Percentage of outgoing Duration Charges on weekend Average of outgoing Minutes of Usage on weekdays Sum of outgoing Duration Charges during peak time Average of outgoing calls during off-peak time Average of outgoing Duration Charges international calls Average of outgoing Minutes of Usage to All Mobile Networks Average of outgoing international calls Sum of outgoing Minutes of Usage during off-peak time Count of outgoing international calls Sum of outgoing Duration Charges local calls Average of outgoing calls during peak time Average of outgoing calls for 2 - 3 minutes in duration Average of outgoing Minutes of Usage Average of outgoing Duration Charges during off-peak time Average of outgoing local SMS Average of outgoing SMS on weekdays Average of outgoing SMS during off-peak time Average of outgoing calls for 3 - 5 minutes in duration Percentage of outgoing calls on weekend Percentage of outgoing calls during peak time Percentage of outgoing calls for 2 - 3 minutes in duration Percentage of outgoing calls for 1 - 2 minutes in duration Count of outgoing SMS during peak time Average of outgoing Duration Charges to Landlines No. of times that subscriber outgoing silent 30 days consecutively Best Predictors
The importance plot short-lists the variables from the data extract that exhibit the strongest relationship with the target variable. Importance plot 1.2 1.0 Importance 0.8 0.6 0.4 0.2 0.0 AVG_OG_VC_PEAK1_REV_M2 SUM_OG_VC_OFFPEAK1_REV_M2 AVG_OG_VC_PTCL_REV_M2 AVG_OG_VC_INT_REV_M2 SUM_OG_VC_OFFPEAK2_MOU_M2 AVG_OG_VC_ALL_MOB_MOU_M2 PER_OG_VC_WE_REV_M2 Avg_OG_SMS_OffPeak_M2 Avg_OG_VC_OffPeak2_M2 AVG_OG_VC_INT_MOU_M2 Cnt_OG_VC_Int_M2 SUM_OG_VC_LOC_REV_M2 Cnt_OG_SMS_Peak_M2 Avg_OG_VC_Peak2_M2 Per_OG_SMS_OFNT_M2 AVG_OG_VC_OMO_MOU_M2 Per_OG_VC_Peak_M2 Avg_OG_VC_2_3_M2 Avg_OG_VC_3_5_M2 Avg_OG_SMS_LOC_M2 Per_OG_VC_2_3_M2 Per_OG_VC_1_2_M2 AVG_OG_VC_WD_MOU_M2 Per_OG_VC_WE_M2 Avg_Activity_Overall_M2 Cnt_OG_VC_Loc_M2 Avg_OG_SMS_WD_M2 SUM_OG_VC_INT_MOU_M2 Cnt_Dormancy_OG_Con_30Days_M2 Cnt_Dormancy_OG_Con_20Days_M2 SUM_OG_VC_MOU_M2 Importance Plot
The table consolidates the proprietary classification models available in the tool ranked in order of ability to classify with highest accuracy the probability of default or target variable against the same set of best predictors available. Boosting trees model had the best predictive accuracy and least false positives for this experiment. Models tested for Accuracy
Gains Chart Gains Chart - Response/Total Response % Include condition: Test Set 100 90 80 70 60 Gains 50 Baseline BoostTreeModel TreeModel CHAIDModel GeneralizedLinearMod MARSplinesModel MARSplinesModel SANNModel SANNModel SANNModel SANNModel SANNModel 40 30 20 10 0 0 10 20 30 40 50 60 70 80 90 100 Percentile The chart summarizes the utility that one can expect by using the respective predictive models, as compared to using baseline information only (corresponds to random selection). Baseline corresponds to random selection of customers while models corresponds to model ordered selection of customers.
The typical hill-like shape of the peaks and easily seen difference between Good and Bad distributions indicate a proper Scorecard performance and its ability to differentiate between Goods and Bads . Good and Bad Distribution Boosting Trees Model 14000 Target = 0 Target = 1 12000 10000 8000 No of obs 6000 4000 2000 0 0.01 0.06 0.11 0.16 0.21 0.26 0.31 0.36 0.41 0.46 0.51 0.56 0.61 0.66 0.71 0.76 0.81 0.86 0.91 0.96 Predicted Good and Bad Distribution of Boosting Trees Model
The correct risk distribution involves a monotonous increase in the odds of the "good" outcome and the opposite for "bad" outcome. Only such distributions allow formulating rules for working with borrowers based on their score, use of the risk-based price formation, etc. This confirms that the Scorecard s performance is logical. Score vs Bad Rate Boosting Trees Model 1 Mean Mean 0.95 Conf. Interval 0.80 0.60 Observed 0.40 0.20 0 0.01 0.06 0.11 0.16 0.21 0.26 0.31 0.36 0.41 0.46 0.51 0.56 0.61 0.66 0.71 0.76 0.81 0.86 0.91 0.96 Predicted Score vs Bad rate
The ability to turn data into value - for the poor segments aiming to improve their livelihoods and living standards; for poor economies looking for ways to deal with poverty, and for businesses looking to new revenue streams is all possible with this experiment given a successful proof of concept. Some conclusions can be drawn: Leverage a predictive analytics and machine learning tool for classification Build products that improve customer life e.g. small loans for rural farmers, small business loans, pay day loans, air-time credit for cellular usage or data usage etc. More variables from internet of things including deep packets inspection can be used to improve the model outcomes e.g. social media usage at the bottom of the pyramid could be an indication of literate customer Develop credit profiles and fine tune models overtime for higher predictive accuracy as more data is gathered with services for these segments Prevent business risks (losses) and maximize potential gains for the economy through an active low income segment by enabling them for basic services and allowing them access to credit and facilities. Conclusion
It is important to know about this experiment because the application of alternative data as an input in both the developed and the developing regions is immense. Machine learning, deep learning and artificial intelligence is using data points to address problem solving across all industries and verticals. The generation of data from e-commerce, smart phones, IOT or internet of things that include vast sensor data, automobiles, retail etc. can be aggregated and consolidated to improve accuracy for existing models and enhance the efficacy. More importantly, as open source data platforms become available, open AI will enable even more use cases for model building in the future as we are already seeing with ChatGPT in 2023. Application


")