Life-Cycle Cost Analysis of Thermally Insulated Concrete Pavements
This research study evaluates the life-cycle costs of thermally insulated concrete pavements (TICP) compared to conventional designs using net present value (NPV). It aims to identify situations where TICP offers potential cost savings and provides a model for comparing alternatives based on variable sensitivity. Tasks involve developing a tool, collecting data from various states, and performing preliminary comparisons. The analysis focuses on agency costs and calculates NPV and crossover points to determine the economic viability of TICP over time.

Download Presentation

Please find below an Image/Link to download the presentation.
The content on the website is provided AS IS for your information and personal use only. It may not be sold, licensed, or shared on other websites without obtaining consent from the author. If you encounter any issues during the download, it is possible that the publisher has removed the file from their server.
You are allowed to download the files provided on this website for personal or commercial use, subject to the condition that they are used lawfully. All files are the property of their respective owners.
The content on the website is provided AS IS for your information and personal use only. It may not be sold, licensed, or shared on other websites without obtaining consent from the author.
E N D
Presentation Transcript
Thermally Insulated Concrete Pavements: Life-Cycle Cost Analysis Methods and Preliminary Results January 10, 2011 John Harvey Nick Santero Lev Khazanovich 1
Background Compare thermally insulated concrete pavements (TICP) with conventional concrete designs using life- cycle cost analysis (LCCA) Use net present value (NPV) to calculate life-cycle costs Develop model to compare various alternatives and test variable sensitivity Identify situations/circumstances where TICP offers potential cost savings, for example: Construction type (new, rehab, etc.) Desired service life Location/Region/Agency 2
Tasks and Status Create TICP/JPCP LCCA tool First version tool created Tool will need updating based on feedback from initial studies and to better reflect non-California practices Survey TICP agencies for input data California information taken from LCCA manual and knowledge, not yet discussed with Caltrans Initial data collected from WSDOT and MnDOT Perform preliminary comparisons Two California cases analyzed using conceptual performance data Additional studies should be performed after performance analyses are completed 3
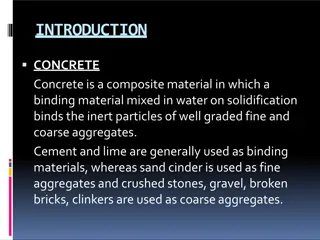
Data Collection and Sources Surveyed three states for data California (Caltrans) Minnesota (MnDOT) Washington (WSDOT) Current analysis uses California data Maintenance schedules, annual maintenance costs and LCCA protocol adapted from Caltrans LCCA Manual Unit material and construction costs for contract maintenance and rehabilitation estimated from Caltrans Construction Cost Database, LCCA Manual and UCPRC studies 4
Model Development LCCA model based in Excel Focuses exclusively on agency cost Calculates NPV and Crossover Points NPV: establishes life-cycle costs over a specified analysis period Crossover points: identifies the future year when one alternative (e.g., TICP) becomes economically rational decision All inputs are user-defined Users can specify agency- or project-specific values for every parameter Additional parameters (e.g., specific material and unit costs) can be added as necessary 5
Model Screenshots (1 of 3) Design and Maintenance Inputs Jointed Plain Concrete Pavement - Design and Costs Parameters Initial Construction Maintenance and Rehabilitation ln-mi= 0.6212 ln-km Initial Construction Design Maintenance and Rehabilitation Summary Value Unit Schedule Init Const. M&R #1 M&R #2 M&R #3 M&R #4 M&R #5 M&R #6 M&R #7 M&R #8 M&R #9 M&R #10 Year 0 45 50 0 0 20 40 0 0 0 0 60 Life 45 5 10 0 20 20 15 0 0 0 0 Cost $8,145,496 $995,182 $1,185,273 Annual Mtce Mainline truck lane length PCC thickness base thickness base density lane width average joint length dowels per joint design life pass lane length $8,945 $33,545 $16,773 18 lane-km 300 mm 150 mm 2.4 Mg/m3 3.9 m 4.1 m 12 45 years 14 lane-km $0 $0 $774,030 $774,030 $774,030 $26,091 $26,091 $26,091 $0 $0 $0 $0 $0 $0 $0 $0 Shoulder shoulder width PCC thickness AC thickness AC density 0 m 0 mm 0 mm 2.4 Mg/m3 Year: Life: 45 5 years $1,864 /yr/ln-km 18 ln-km truck lanes Maintenance and Rehabilitation #1 Annual Maintenance Cost $497 /yr/ln-km Annual Mtce: Length: Traffic Handling cost factor construction duration 0.15 74 days Activity/Material CPR-C Traffic handling Unit ln-km ls Unit Cost No. Units Subtotal Cost $995,182 $55,288 149,277.27 18 0 $0 $0 $0 $0 Initial Construction Costs 6 Activity/Material PCC material (mainline) PCC material (shoulder) AC material (shoulder) base material dowels PCC placement (mainline) shoulder placement base placement dowel placement joint preparation subgrade preparation remove concrete pavement traffic handling mobilization diamond grinding Unit m3 m3 Mg m3 each m3 m3 Mg each joint m2 m3 % project m2 Unit Cost No. Units Subtotal Cost $4,001,400 Total Cost $995,182 $190 $168 $98 $192 $0 $0 21060 0 0 $0 $0 10530 $2,021,760 52682.9268 21060 $0 $0 $0 $0 $0 $0 Year: Life: 50 10 years $932 /yr/ln-km 18 ln-km truck lanes Maintenance Rehabilitation #2 0 Annual Mtce: Length: 25272 52682.9268 4390.2439 140400 31590 Activity/Material CPR-B Traffic handling Unit ln-km ls Unit Cost No. Units Subtotal Cost $1,185,273 $2 $12 $280,800 $379,080 $1,062,456 $400,000 $65,848 $177,791 18 0 $0 $0 $0 $0 7,083,040 $400,000 74 1 $0 $0 $0 $0 $0 Total Cost $1,185,273 Total Cost $8,145,496 Year: Life: years /yr/ln-km ln-km Maintenance Rehabilitation #3 Annual Mtce: Length: Activity/Material Unit Unit Cost No. Units Subtotal Cost $0 $0 $0 $0 $0 $0 Total Cost Year: Life: 0 pass lanes Maintenance Rehabilitation #4 20 years $1,864 /yr/ln-km 14 ln-km Annual Mtce: Length: Activity/Material CPR-C passenger lanes Traffic handling Unit ln-km ls Unit Cost No. Units Subtotal Cost $774,030 $55,288 $116,105 14.0 0 $0 $0 $0 $0 Total Cost $774,030 Year: Life: 20 20 years $1,864 /yr/ln-km 14 ln-km pass lanes Maintenance Rehabilitation #5 Annual Mtce: Length: Activity/Material CPR-C passenger lanes Traffic handling Unit ln-km ls Unit Cost No. Units Subtotal Cost $774,030 $55,288 $116,105 14.0 0 $0 $0 $0 $0 Total Cost $774,030 Year: Life: 40 15 years $1,864 /yr/ln-km 14 ln-km pass lanes Maintenance Rehabilitation #6 Annual Mtce: Length: Activity/Material CPR-C passenger lanes Traffic handling Unit ln-km ls Unit Cost No. Units Subtotal Cost $774,030 $55,288 $116,105 14.0 0 $0 $0 $0 $0 Total Cost $774,030
Model Screenshots (2 of 3) NPV Results Net Present Value Calculations LCCA Inputs Discount Rate Analysis Period 4.0% 55 years Net Present Value Results Pavement JPCP TICP NPV TICP JPCP thickness 153 $10,500,878 $10,500,878 LCCA Calculations: JPCP LCCA Calculations: TICP Net Present Value Net Present Value Schedule Init Const. M&R #1 M&R #2 M&R #3 M&R #4 M&R #5 M&R #6 M&R #7 M&R #8 M&R #9 M&R #10 Year 0 45 50 0 0 20 40 0 0 0 0 Life 45 5 10 0 20 20 15 0 0 0 0 Activity $8,145,496 $170,374 $166,783 Ann. Mtce $185,350 $25,566 $10,507 Salvage Schedule Init Const. M&R #1 M&R #2 M&R #3 M&R #4 M&R #5 M&R #6 M&R #7 M&R #8 M&R #9 M&R #10 Year 0 0 0 50 0 50 0 0 0 0 0 Life 50 0 0 8 0 15 0 0 0 0 0 Activity $8,178,774 $2,109,564 $0 $0 $143,181 $0 $182,364 $0 $0 $0 $0 $0 Ann. Mtce Salvage $0 $0 $0 $0 $0 $0 $0 -$68,542 $0 $0 $0 $0 $0 $0 $0 $0 $0 $0 $4,903 -$44,132 $774,030 $353,257 $161,222 $354,584 $161,827 $60,422 $0 $0 $26,151 -$99,926 $0 $0 $0 $0 $0 $0 $0 $0 $0 $0 $0 $0 $0 $0 $0 $0 $0 $0 7
Model Screenshots (3 of 3) Time Series and Crossover Points Cumulative NPV $6,000,000 45 $5,000,000 Net Present Value $4,000,000 JPCP $3,000,000 Composite $2,000,000 Crossover Point $1,000,000 $0 0 10 20 30 40 50 Year 60 70 80 90 100 8
LCCA Approach Solve for two key unknowns: 1. Maximum PCC thickness for TICP in order to be cost effective compared to JPCP 2. Minimum extension of life needed by TICP design in order to be cost effective compared to JPCP 9
California Case Studies Case 1: Lane replacement of truck lanes in Southern California as TICP instead of JPCP. This project is based on the scope of a real project on I-15 near Devore (District 8). Case 2: Convert multi-lane highway in Northern California into divided highway by adding new direction with TICP instead of JPCP. This project is roughly based on the scope of a real project on State Route 70 near East Nicholas (District 3). 10
California Designs Case 1 Lane Replacement Case 2 New Construction (in mm) AC surface PCC AC base JPCP TICP #1 30, 45 300* 150 TICP #2 75, 105 255* 150 JPCP TICP # 1 30, 45 255* 150 TICP #2 75, 105 225* 150 AC surface PCC LCB base 300 150 255 150 Two TICP designs are compared for each Case Study Thinner versus thicker PCC slab thickness When solving for PCC thickness, asterisked (*) thickness are solved for rather than inputted AC surface is either conventional hot-mix asphalt (HMA) or rubberized hot-mix asphalt (RHMA) Factorial considers price of both materials Future maintenance schedules adapted from Caltrans LCCA manual 11
California Factorial Each case and design was evaluated by altering several key parameters AC surface thickness and type (30, 45 for HMA and RHMA; 75 for RHMA and 105 mm for HMA) AC unit cost ($154 or $192/m3 for HMA, $192 or $240/m3 for RHMA); unit cost for PCC was $190/m3 Traffic handling costs (15%, 50% of construction costs) Future factorials could be run for other design uncertainties Unit price for TICP concrete slab Cost changes for smoothness requirements 12
California Results Example for Thickness Solutions Traffic Handling Cost on M&R (% pave cost) 15 15 15 15 15 15 50 50 50 50 50 50 TICP HMA/RHMA type, thickness HMA 105 mm RHMA 75 mm HMA 30 mm HMA 45 mm RHMA 30 mm RHMA 45 mm HMA 105 mm RHMA 75 mm HMA 30 mm HMA 45 mm RHMA 30 mm RHMA 45 mm TICP Design No. 1 1 2 2 2 2 1 1 2 2 2 2 JPCP PCC thickness (mm) 300 300 255 255 255 255 300 300 255 255 255 255 TICP PCC thickness for equal NPV (mm) 171 185 217 196 207 180 175 190 229 208 218 192 13
California Results Example for Life Extension Solutions Traffic Handling Cost on M&R (% pave cost) 15 15 15 15 15 15 50 50 50 50 50 50 HMA/RHMA type, thickness HMA 105 mm RHMA 75 mm HMA 30 mm HMA 45 mm RHMA 30 mm RHMA 45 mm HMA 105 mm RHMA 75 mm HMA 30 mm HMA 45 mm RHMA 30 mm RHMA 45 mm TICP Design No. JPCP PCC thickness 300 300 300 300 300 300 300 300 300 300 300 300 TICP PCC thickness 300 300 255 255 255 255 300 300 255 255 255 255 TICP % PCC life change for same NPV >70% >70% 24% 54% 37% >70% >70% >70% 17% 44% 30% 67% 1 1 2 2 2 2 1 1 2 2 2 2 14
California Results Summary Results indicate that marginal PCC thickness reductions in TICP are needed to make the pavement cost effective compared with JPCP Results are similar for both Case 1 (lane replacement) and Case 2 (new construction) Results are especially favorable to TICP when asphalt costs are lower Life extension results are mixed for the different cases Case 1: some scenarios (e.g., shorter initial service lives and lower asphalt costs) found minimal (<30%) life extension needed to be competitive with JPCP, others found unreasonably high life extensions needed Case 2: all scenarios required large life extensions in order to be competitive with JPCP 15
Key Limitations and Assumptions Cost of PCC assumed to be same for life extension cases, where PCC layer has same thickness in both JPCP and TICP. May be conservative if specifications for TICP pavement PCC include relaxed smoothness and other surface characteristics requirements. For PCC thickness requirement cases, cost per volume of the PCC is assumed to be same for new JPCP and TICP pavements. PCC unit costs for TICP may be lower if mix specification changes regarding surface durability. Potential environmental benefits not considered through a Life Cycle Assessment (LCA). PCC in TICP pavements may use higher percentages of supplementary cementitious materials, recycled concrete aggregates, or lower cost local aggregates. Offsetting benefits are environmental costs of HMA. Analysis does not consider noise or ride quality over the life cycles. No user delay costs caused by construction were included. 16


")
")
")