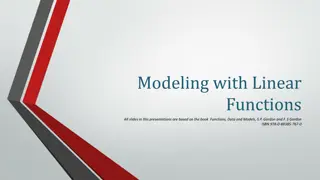
Linear Regression Assumptions and Model Definitions
Dive into the world of linear regression, exploring the assumptions, definitions, and modeling processes essential for making accurate predictions and forecasts where data may be scarce. Learn about parameter estimation, the role of axes in creating predictions, and the nuances of multiple linear regression. Uncover the significance of performance measures and normal distribution in refining your modeling techniques.

Download Presentation

Please find below an Image/Link to download the presentation.
The content on the website is provided AS IS for your information and personal use only. It may not be sold, licensed, or shared on other websites without obtaining consent from the author. If you encounter any issues during the download, it is possible that the publisher has removed the file from their server.
You are allowed to download the files provided on this website for personal or commercial use, subject to the condition that they are used lawfully. All files are the property of their respective owners.
The content on the website is provided AS IS for your information and personal use only. It may not be sold, licensed, or shared on other websites without obtaining consent from the author.
E N D
Presentation Transcript
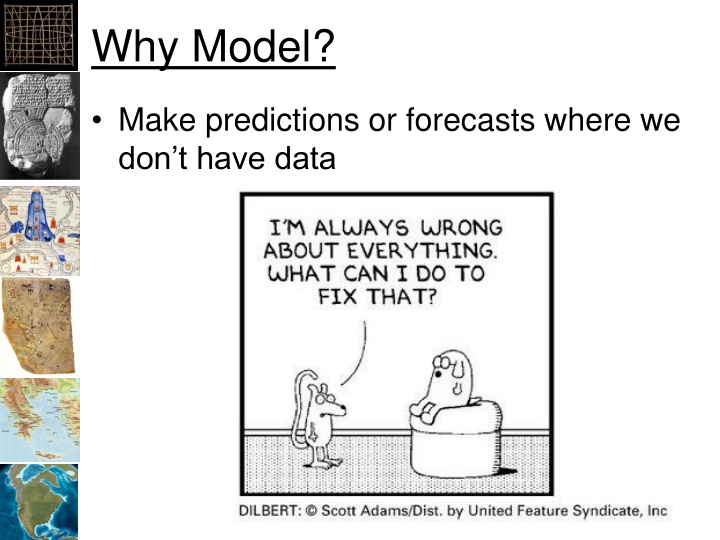
Why Model? Make predictions or forecasts where we don t have data namNm15
Linear Regression namNm15 wikipedia
Activity Use the discussion sheet to create a linear regression chart on the white board and on the discussion sheet. namNm15
Definitions Horizontal axis: Used to create prediction Independent variable Explanatory variable Covariate? Predictor variable Control variable Typically a raster Examples: Temperature, aspect, SST, precipitation Vertical axis: What we are trying to predict Dependent variable Response variable Measured value Explained Outcome Typically an attribute of points Examples: Height, abundance, percent, diversity, namNm15
Modeling Process Select Model Observe Define Theory/ Type of Model Estimate Parameters Design Experiment Evaluate the Model Collect Data Publish Results namNm15 Qualify Data
Definitions The Model the specific algorithm that predicts our dependent variable values Parameters the values in the model we estimate (i.e. a/b, m/b for linear regression) Aka, coefficients or estimated parameters Performance measures show how well the model fits the data Aka, descriptive stats namNm15
Parameter Estimation Excel spreadsheet X, Y columns Add trend line namNm15
Linear Regression: Assumptions Predictors are error free Linearity of response to predictors Constant variance within and for all predictors (homoscedasticity) Independence of errors Lack of multi-colinearity Also: All points are equally important Residuals are normally distributed (or close). namNm15
Multiple Linear Regression namNm15
Normal Distribution ? = ???? ? = ???????? ????????? To negative infinity To positive infinity 68.2% 95.4% 99.7% namNm15
namNm15 https://www.spss-tutorials.com/
Linear Data Fitted w/Linear Model namNm15 Should be a diagonal line for normally distributed data
Non-Linear Data Fitted with a Linear Model namNm15 This shows the residuals are not normally distributed
Homoscedasticity Residuals have the same normal distribution throughout the range of the data namNm15
Ordinary Least Squares namNm15
Linear Regression Residual namNm15
Parameter Estimation namNm15
Evaluate the Model namNm15
Goodness of fit namNm15
1.2 y = 0.0024x + 0.4347 R = 0.0051 1 0.8 0.6 0.4 0.2 namNm15 0 0 5 10 15 20 25 30 35
35 30 y = 1.0029x + 0.4188 R = 0.999 25 20 15 10 5 namNm15 0 0 5 10 15 20 25 30 35
Good Model? namNm15 Anscombe's quartet, nearly identical descriptive statistics
Two Approaches Hypothesis Testing Is a hypothesis supported or not? What is the chance that what we are seeing is random? Which is the best model? Assumes the hypothesis is true (implied) Model may or may not support the hypothesis Data mining Discouraged in spatial modeling Can lead to erroneous conclusions namNm15
p-value: Significance? H0 Null hypothesis (flat line) Hypothesis Regression line not flat The smaller the p-value, the more evidence we have against H0 The more evidence our hypothesis is true Measure of how likely we are to get a certain sample result or a result more extreme, assuming H0 is true The chance the relationship is random namNm15 http://www.childrensmercy.org/stats/definitions/pvalue.htm
Confidence Intervals 95 percent of the time, values will fall within a 95% confidence interval Methods: Moments (mean, variance) Likelihood Significance tests (p-values) Bootstrapping namNm15
Model Evaluation Parameter sensitivity Ground truthing Uncertainty in data AND predictors Spatial Temporal Attributes/Measurements Alternative models Alternative parameters namNm15
Model Evaluation? namNm15
Robust models Domain/scope is well defined Data is well understood Uncertainty is documented Model can be tied to phenomenon Model validated against other data Sensitivity testing completed Conclusions are within the domain/scope or are possibilities See:https://www.youtube.com/watch?v= HuyMQ-S9jGs namNm15
Modeling Process II Select Model Investigate Estimate Parameters Evaluate the Model Find Data Publish Results namNm15 Qualify Data
Three Model Components Trend (correlation) We have just been talking about these Random Noise that is truly random or an effect on our data we do not understand (or are ignoring) Auto-correlated Values that are correlated with themselves in space and/or time namNm15
First Law of Geography "Everything is related to everything else, but near things are more related than distant things. Geographer Waldo Tobler (1930-) In our data, we may see patterns of spatial autocorrelation. namNm15
Measures of Auto-Correlation Moran s I most common measure 1 = perfect correlation 0 = zero correlation -1 = negative correlation namNm15 https://docs.aurin.org.au
Patches of Aspen namNm15 http://www.shutterstock.com/
Process of Correlation Modeling Find the trends that can be correlated with a known data set. Model and remove them. Find any auto-correlation. Model and remove it? What is left is the residuals (i.e. noise, error, random effect). Characterize them. namNm15
Research Papers Introduction Background Goal Methods Area of interest Data sources Modeling approaches Evaluation methods Results Figures Tables Summary results Discussion What did you find? Broader impacts Related results Conclusion Next steps Acknowledgements Who helped? References Include long URLs namNm15