Linear Regression Diagnostics
The essential conditions for a valid least squares line in linear regression, including linearity, nearly normal residuals, and constant variability. Learn how to assess linearity through scatterplots, evaluate residuals' normality using histograms or Q-Q plots, and understand the anatomy of residual and normal probability plots. Practice analyzing NBA heights data for normal distribution.

Download Presentation

Please find below an Image/Link to download the presentation.
The content on the website is provided AS IS for your information and personal use only. It may not be sold, licensed, or shared on other websites without obtaining consent from the author.If you encounter any issues during the download, it is possible that the publisher has removed the file from their server.
You are allowed to download the files provided on this website for personal or commercial use, subject to the condition that they are used lawfully. All files are the property of their respective owners.
The content on the website is provided AS IS for your information and personal use only. It may not be sold, licensed, or shared on other websites without obtaining consent from the author.
E N D
Presentation Transcript
Linear Regression Diagnostics
Conditions for the least squares line 1. Linearity 2. Nearly normal residuals 3. Constant variability
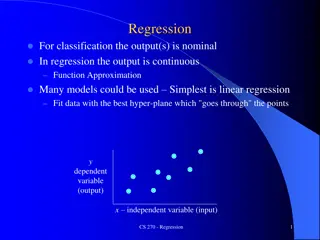
Conditions: (1) Linearity The relationship between the explanatory and the response variable should be linear. Methods for fitting a model to non-linear relationships exist, and will be covered in a different video. Check using a scatterplot of the data, or a residuals plot.
Poverty vs. HS graduate rate The scatterplot below shows the relationship between HS graduation rate in all 50 US states and DC and the percent of residents who live below the poverty line (income below $23,050 for a family of 4 in 2012). Response variable % in poverty Explanatory variable % HS grad Relationship linear, negative, moderately strong RI
Conditions: (2) Nearly normal residuals The residuals should be nearly normal. This condition may not be satisfied when there are unusual observations that don't follow the trend of the rest of the data. Check using a histogram or normal probability (Q-Q) plot of residuals.
Normal probability plot A histogram and normal probability plot of a sample of 100 male heights.
Anatomy of a normal probability plot Data are plotted on the y-axis of a normal probability plot, and theoretical quantiles (following a normal distribution) on the x- axis. If there is a linear relationship in the plot, then the data follow a nearly normal distribution. Constructing a normal probability plot requires calculating percentiles and corresponding z-scores for each observation, which is tedious. Therefore we generally rely on software when making these plots.
Practice Below is a histogram and normal probability plot for the NBA heights from the 2008-2009 season. Do these data appear to follow a normal distribution?
Normal probability plot and skewness Right skew - Points bend up and to the left of the line. Left skew - Points bend down and to the right of the line. Short tails (narrower than the normal distribution) - Points follow an S shaped-curve. Long tails (wider than the normal distribution) - Points start below the line, bend to follow it, and end above it.
Conditions: (3) Constant variability The variability of points around the least squares line should be roughly constant. This implies that the variability of residuals around the 0 line should be roughly constant as well. Also called homoscedasticity. Check using a histogram or normal probability plot of residuals.
Checking conditions What condition is this linear model obviously violating? (a) Constant variability (b)Linear relationship (c) Normal residuals (d)No extreme outliers
Checking conditions What condition is this linear model obviously violating? (a) Constant variability (b) Linear relationship (c) Normal residuals (d)No extreme outliers
Checking conditions What condition is this linear model obviously violating? (a) Constant variability (b)Linear relationship (c) Normal residuals (d)No extreme outliers
Checking conditions What condition is this linear model obviously violating? (a) Constant variability (b)Linear relationship (c) Normal residuals (d)No extreme outliers


 Linearity")


 Nearly normal residuals")


 Constant variability")