Linking Attack Scenario in Online Genotype-Phenotype Correlation

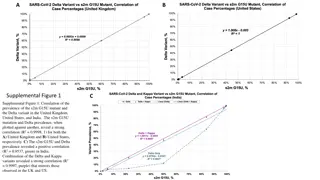
This content presents a detailed scenario of a linking attack in online databases involving the acquisition of public phenotype datasets and stolen or queried genotype datasets. It explores the correlation between genotype and phenotype data, genotype prediction, matching genotypes, and HIV status identification. The figures depict various aspects of the attack scenario and datasets related to genotype and phenotype relationships, eQTL datasets, vulnerable individuals, and mispredicted genotypes.

Download Presentation

Please find below an Image/Link to download the presentation.
The content on the website is provided AS IS for your information and personal use only. It may not be sold, licensed, or shared on other websites without obtaining consent from the author.If you encounter any issues during the download, it is possible that the publisher has removed the file from their server.
You are allowed to download the files provided on this website for personal or commercial use, subject to the condition that they are used lawfully. All files are the property of their respective owners.
The content on the website is provided AS IS for your information and personal use only. It may not be sold, licensed, or shared on other websites without obtaining consent from the author.
E N D
Presentation Transcript
PrivaSeq Figure Pack May 12, 2015
Fig 1a: Linking Attack Scenario Online Databases Data Acquisition Phenotype Dataset (Public) Genotype Dataset (Stolen/Hacked/Queried) Phenotype-Genotype Correlation Dataset Genotype ID Phenotype ID Phenotype 1 Variant 1 Phenotype 2 Variant 2 GID-1 PID-1 HIV+ HIV- GID-2 PID-2 Phenotype ? Variant ? GID-m PID-? HIV- Genotype Prediction Predicted Variant Genotypes Phenotype ID HIV+ HIV- Genotype Comparison and Matching PID-1 PID-2 HIV- PID-? Predicted/Matched Genotypes HIV Status Phenotype ID Genotype ID HIV+ GID-1 PID-8 HIV- GID-2 PID-3 PID-1 HIV- GID-3 GID-4 PID-1 HIV+ GID-5
Fig 1a: Linking Attack Scenario Online Databases Data Acquisition Phenotype Dataset (Public) Genotype Dataset (Stolen/Hacked/Queried) Phenotype-Genotype Correlation Dataset Genotype ID Phenotype ID Phenotype 1 Variant 1 Phenotype 2 Variant 2 GID-1 0 1 1 PID-1 HIV+ HIV- 90.3 -2.7 0.1 GID-2 2 1 PID-2 0 63.5 8.6 0.5 Phenotype ? Variant ? GID-m 1 PID-? 2 1 HIV- 50.3 5.4 -0.2 Genotype Prediction Predicted Variant Genotypes HIV Status Phenotype ID HIV+ HIV- Genotype Comparison and Matching 1 0 2 PID-1 PID-2 2 2 1 HIV- PID-? 0 1 1 Predicted/Matched Genotypes HIV Status Phenotype ID Genotype ID HIV+ GID-1 PID-8 0/0 1/1 1/1 HIV- GID-2 PID-3 2/2 1/1 0/0 PID-1 1/0 1/0 HIV- 0/2 GID-3 GID-4 2/2 0/0 1/1 PID-1 HIV+ GID-5 0/1 1/1 2/1
Fig 1a: Linking Attack Scenario Online Databases Data Acquisition Phenotype Dataset (Public) Genotype Dataset (Stolen/Hacked/Queried) Phenotype-Genotype Correlation Dataset Genotype ID HIV Status Phenotype ID Phenotype 1 Variant 1 Phenotype 2 Variant 2 GID-1 PID-1 HIV+ HIV- GID-2 PID-2 Phenotype ? Variant ? GID-m PID-? HIV- Genotype Prediction Predicted Variant Genotypes Phenotype ID HIV Status HIV+ HIV- Genotype Comparison and Matching PID-1 PID-2 HIV- PID-? Phenotype ID Genotype ID HIV Status HIV+ GID-1 PID-8 HIV- GID-2 PID-3 PID-1 HIV- GID-3 GID-4 PID-1 HIV+ GID-5
Fig 1b: Datasets Genotype Matrix ?? ? ? ~?? ? ?? ??,? ? (??,??) eQTL Dataset ? ?? ?(??,??) 1 2 0 ? ??,? ? ~?? ?? Expression Matrix
Fig 2a ?1 Phenotype 1 Variant 1 Vulnerable Individual Decreasing Phenotype-Genotype Correlation and Predictability ?2 Non-vulnerable Individual Phenotype 2 Variant 2 ?? Increasing Number of Potentially Characterizable Individuals Phenotype ? Variant ? Increasing Fraction of Individuals with Mispredicted Genotypes ?? Phenotype ? Variant ? |?1> |?2 > > |??|
Fig 2a ?1 Vulnerable Individual Phenotype 1 Variant 1 Decreasing Phenotype-Genotype Increasing Fraction of Individuals Increasing Number of Potentially Correlation and Predictability Non-vulnerable Individual ?2 with Mispredicted Genotypes Characterizeable Individuals Phenotype 2 Variant 2 ?? Phenotype ? Variant ? ?? Phenotype ? Variant ? |?1> |?2 > > |??|
Fig 2b Colors by Major Allele Frequency Colors by Absolute Correlation Major Allele Frequency Absolute Correlation
Fig 2c: Predictability vs Information leakage: Multiple eQTLs 10 9 8 7 6 5 4 3 2 1
Fig 3: 3 Steps of Linking Attack Step 1 Step 3 Step 2 Gender, Population, Age G-P Prediction Methodology Auxiliary Information Correlation Dataset Phenotype and Genotype Selection Genotype Prediction Linking Minimum Distance between Predicted and Individual Genotypes Maximum a Posteriori Genotype Absolute Value of Correlation
Figure 4a: MAP Genotype Prediction Accuracy
Fig 4b: Fraction of Vulnerable Individuals
Fig 5a: Extremity based genotype prediction Negative Extremity Positive Extremity Frequency Expression Lower expression: Negative Extremity Most likely TT Higher expression: Positive Extremity Most likely CC
Fig 5bcd (5b) (5c) (5d)
Table S1ab: Per population and per tissue stratification (a) eQTLs Trained On TSI CEU FIN GBR YRI # linked/# total eQTLs Tested On - 92/92 92/92 92/92 81/92 TSI 77/78 - 78/78 77/78 50/78 CEU 89/89 88/89 - 89/89 74/89 FIN 85/85 84/85 84/85 - 61/85 GBR 67/77 36/77 66/77 68/77 - YRI (b) eQTLs Trained On Whole Blood Lung Stomach Muscle-Skeletal Thyroid Adipose # linked/# total Whole GEUVADIS 370/421 366/421 344/421 319/421 350/421 356/421
Table S2 Method (# of input data per eQTL) Top 1000 eQTLs Extremity Attack (1 data point) 174/174 Schadt et al (All training data) 173/174 Schadt et al (20 data points) 136/174 Schadt et al (30 data points) 171/174 Schadt et al (40 data points) 173/174 Schadt et al (50 data points) 169/174
Fig S1ab: eQTL properties (b) (a)
Fig S2a: Computation of Cumulative ICI and Predictabilities Phenotype Measurements for Individual j Sort P-G correlations in decreasing order Select the top variants to predict Predict the Genotypes for Individual j ?1 Decreasing Phenotype-Genotype Phenotype 1 Variant 1 Joint Predictability of Genotypes: Correlation and Predictability ?2 ? ?1,?1, ,?? | Phenotypes Phenotype 2 Variant 2 ?? Individual Characterizing Information: ICI ?1,?1, ,?? Phenotype ? Variant ? ?? Phenotype ?? Variant ??
Fig S2b: Illustration of a priori, a posteriori distributions Posterior: ? ?? | ??= 10 Joint: ? ??,?? Prior: ? ?? ? ?,?= 2
Fig S4ab (a) (b)
Fig S5: Illustration of linking for the ?? Individual Phenotype Dataset Predicted Genotypes Genotype Prediction ? ,? j Genotype Distance Computation Sort Distances ??, 1 ?2,1 ??, 2 a ? ? ,?,? ,? ? ,? ? ,? b ? ? ,?,? ,? Genotype Dataset Genotype Distances Sorted Distances
Fig S6ab: Linking Attacks vs Genome in a Mixture Attacks Detection of a Genome in a Mixture Attacks (Homer et al, Im et al) Linking Attacks (Schadt et al, Extremity attack) (a) (b) Sensitive Phenotypes Predicting Phenotypes Genotype Dataset QTL Study Statistics --------------------- Population Genotyping Study Statistics Genotype Prediction Statistical Testing Predicted Genotypes Sensitive Phenotypes Genotypes IDs Reference Population Allele Frequencies Genotype Linking Study Genotype Dataset Membership Status (0/1) Sensitive Phenotypes Predicted Genotypes IDs Genotypes
Fig S7: Extremity Based Linking Attack 1 Genes Phenotype Dataset Positive Extreme Expression HIV Status Negative Extreme Expression PID Non-Extreme Expression PID-a PID-b PID-c eQTL Dataset rs7274244 rs6052708 rs8122783 rs12479581 ABCB1 RAB HIST3 M6PR RNF5 DNAJC3 Genotype Prediction rs6053462 rs6077023 2 3 Genotype Dataset + Linkings SNPs Genotype Predictions HIV Status PID Name PID-a Bob PID-b Alice PID-c John PID-k Correct Genotype Prediction (Positive Extreme Phenotype) Correct Genotype Prediction (Negative Extreme Phenotype) Incorrect Genotype Prediction
Fig S8: Generalized Risk Assessment Procedure ICI ? QTL Discovery Leakage vs Predictability Quantification Significant Quantitative Trait Loci QTL Risk Joint Genotyping And Phenotyping Identification Assessment Section 2.2 Phenotype Dataset External QTL Databases Genotype Dataset Application of 3-step Linking Attacks Risk Assessment Sections 2.3 and 2.4 Linking Accuracy QTL Selection
Fig S9: Modeling of Joint Genotype-Expression Distribution ?? ?? ?(??,??) ?(??,??) (b) (a) 3 ?3 2 ?2 1 ?1 ?? ?? 1 2 1 2 0 0 ?? ?? ?(??,??) (c) (d) ?(??,??) ?4 3 ? ?3 2 ? 1 ? ?2 ?1 ?? ?? 1 2 0 0 1 2 ?? (e) ?(??,??) ???? ?? 1 0 2