LLIN Durability Monitoring Capacity Building Workshop Overview
Explore the design principles, sample size calculations, and cluster sampling for LLIN durability monitoring capacity building workshop. Learn about the basic requirements, early design considerations, and post-campaign design options. Gain insights into prospective and retrospective design approaches, guided by PMI recommendations for decision-making on LLIN replacements.
Download Presentation

Please find below an Image/Link to download the presentation.
The content on the website is provided AS IS for your information and personal use only. It may not be sold, licensed, or shared on other websites without obtaining consent from the author. If you encounter any issues during the download, it is possible that the publisher has removed the file from their server.
You are allowed to download the files provided on this website for personal or commercial use, subject to the condition that they are used lawfully. All files are the property of their respective owners.
The content on the website is provided AS IS for your information and personal use only. It may not be sold, licensed, or shared on other websites without obtaining consent from the author.
E N D
Presentation Transcript
LLIN Durability Monitoring Capacity Building Workshop PMI DM design, sample size and cluster sampling
Overview The principle design and why it was chosen Sample size and how to calculate variations Sampling of clusters using PPS
Basic Requirement Need unique starting point for measurement Distribution of nets by study team Use campaign distribution Durability assessment not feasible for continuous distribution For post-campaign DM need a representative sample of distributed nets
Early Design - WHOPES WHOPES Phase III field trials Focus on bio-assay and chemical residue Not ideal for durability monitoring
Design options for Post-campaign Prospective, longitudinal Sample net cohort Assess Distribution Assess Assess Prospective, cross-sectional (sub-population) Distr. cohort tagged nets Establish s.-frame Assess Distribution Assess Assess Retrospective, cross-sectional Recall for nets received, nets lost
Design options for Post-campaign Recall bias Retrospective, cross-sectional Recall for nets received, nets lost
Prospective, longitudinal Design options for Post-campaign Sample net cohort Assess Distribution Assess Assess Prospective, cross-sectional (sub-population Distr. cohort tagged nets Establish s.-frame Assess Distribution Assess Assess Hawthorne effect, but not important as both attrition and integrity are included
PMI guidance on DM Prospective, longitudinal design Representative sample Baseline (establish cohort) 0 1-6 12 24 36 Assess Attrition Integrity Assess Attrition Integrity Assess Attrition Integrity Assess Attrition Integrity Distribution Subsample: Bio-assay Subsample: Bio-assay Subsample: Bio-assay Chemical residue Subsample: Bio-assay optional
PMI guidance on DM Inform decisions on replacement of LLIN (intervel, strategy) Identify LLIN brands with good or poor performance in the country Highlight potential differences or trends in net care and repair behavior and inform BCC activities Two options: Compare two different LLIN brands in similar environment Compare same LLIN brand in different environments
PMI DM Sample Size The standard recommended sample size is targeting a cohort of 345 campaign nets per site This is sufficient to detect a 18%-points difference from the expected 50% survival after three years comparing the best and the poorest performing site or brand It will be able to detect roughly a one year difference in median survival The representative sample of cohort nets is obtained through 150 households in 15 clusters under standatd assumptions of 5 people/HH and 1 LLIN per two people distributed
PMI DM Sample Size If standard assuption do not apply, sample size can be modified using the DM sample size calculator
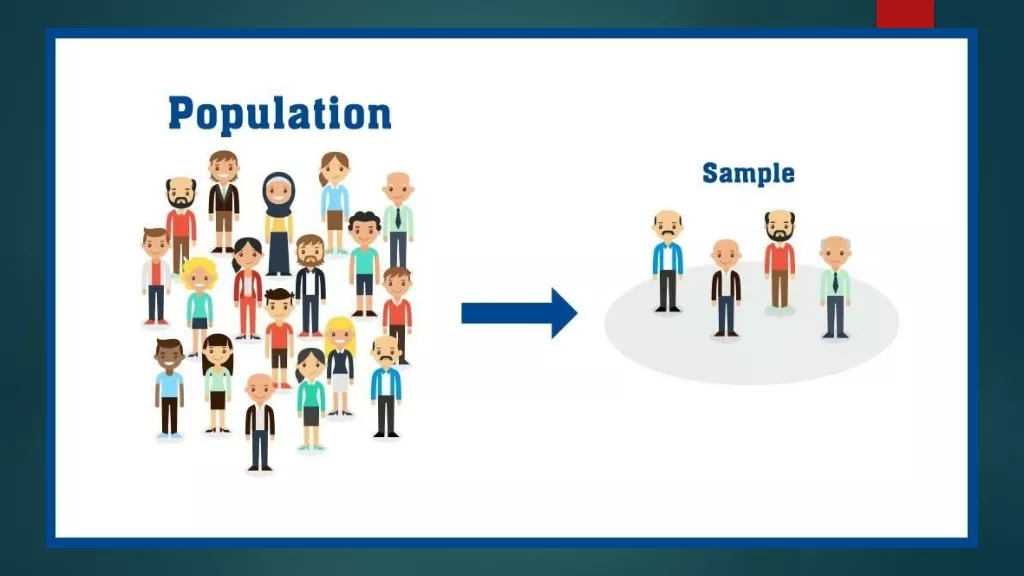
Objective of Surveys To obtain a representative estimate of the indicator of interest from the population at risk (or of interest) .an unbiased picture of the truth without having to look at everybody or everything Myth: In order to be representative I need to include at least x% of my study population ..
Two Concepts Accuracy Precision Is it an accurate picture of reality ? How precise is my estimate ? Repeatability Representativeness Sample size Variation Sampling
Precision Sample size The higher the sample size the better the precision Statistical significance does not always mean programmatic significance Even very small samples can be useful (LQAS)
Accuracy Sampling If the studied items were homogeneous any sampling method will be accurate
Accuracy Sampling But because they usually are not sampling is so important Ideally one would have a complete list of all study objects (sampling frame) and directly selects from the list the needed number If that is not possible sub-units of study objects can be selected (clusters) Health facilities Settlements Schools Two-stage cluster sampling
Cluster Sampling First select the clusters (stage one) And then the study objects in cluster (stage two)
Stage one Whenever possible the first stage should be done from some kind of list using Probability Proportionate to Size or PPS Need list of clusters and any measure of size PPS is a systematic sampling which allocates more units where more people are living We have an excellent tool for a semi-automatic selection of clusters (adapted from a tool developed by statisticians at LSTMH)
Principle of PPS sampling Obtain a sampling frame of every possible cluster (e.g. village) with some measure of size Registration or micro-planning list by village from campaign Create a cumulative list of the size Divide cumulative total by n=number of desired clusters > this is k, the sampling interval Randomly find a number between 1 and k, this is the starting point > the village where the selected size is found is selected as first cluster Now add the k interval to select the remaining clusters
Principle of PPS sampling k= 21,484/15=1,432 1st cluster 2nd cluster 3rd cluster Random number 1-1,432 = 1,251 4th cluster Start +k 1,251+1,432=2,683 Last +k 2,683+1,432=4,115 Last +k 4,115+1,432=5,547
Cluster Sampling Tool Data produced by tool Data entered from sampling frame
Cluster Sampling Tool Step 1: create cumulative list of size , here population
Cluster Sampling Tool Step 2: make sure the sub-total of size is set correctly (default=495 rows of data)
Cluster Sampling Tool Step 5: set the number of clusters you want, here 15
Cluster Sampling Tool Step 6: a scaled cumulative size is created that is scaled to the number of clusters selected: cumulative total in row/total*# of clusters
Cluster Sampling Tool Step 7: next a random number between 0 and 1 is selected as starting point, copied to a fixed field (paste > value only!) and added to the first scaled value
Cluster Sampling Tool Step 8: now a selection of clusters by PPS can be made by determining each time the scaled + random changes the integer
Cluster Sampling Tool Step 9: we now want to filter for the selected clusters. In order to do that we need to copy-paste the selection into a fixed column using values only
Cluster Sampling Tool Step 10: using the filter option select all values >0 in
Cluster Sampling Tool Step 11: Finally, the selected clusters are copy- pasted into a new sheet called selected clusters and given a cluster number 101-115 for site 1 and 201-215 for site 2
What to do when sampling frame at cluster level is not available? Often lists from campaigns (micro-planning, registration or distribution) are only available at a higher administrative level (Health facility catchment area, DP or ward etc.) In this case the PPS is done as described but at the higher level May result in multiple clusters allocated to one unit In a second step a list of all possible clusters (villages or communities) of the selected higher level units are compiled and clusters are selected using simple random sampling
Exercise In the materials under sample size and cluster sampling you will find The DM sample size tool (file 2h ) PPS cluster sampling tool.xlsx The tool not yet filled Sampling frame data.xlsx Example sample frame from Kenya Filled PPS cluster sampling too as Example.xlsx The tool filled with the Kenya data to see what it should look like
Exercise (2) Open the sample size calculator and adjust sample size for a situation where mean household size is only 4.0 but we still need at least 345 cohort nets at baseline Use the PPS sampling tool and the Kenya sampling frame data to make a PPS selection of 15 clusters and copy them to the selected clusters sheet Play around with the tool so you understand how it works

