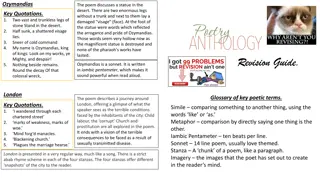
Explore the fascinating corporate history of Lloyds of London, from its humble beginnings in 1688 as a coffee house to becoming a dominant force in shipping insurance. Learn about key milestones, such as the establishment of Lloyd's Agency and the market's evolution into non-marine lines of coverage. Witness the modernization efforts and regulatory changes that have shaped Lloyd's into the renowned institution it is today.
Please find below an Image/Link to download the presentation.
The content on the website is provided AS IS for your information and personal use only. It may not be sold, licensed, or shared on other websites without obtaining consent from the author. If you encounter any issues during the download, it is possible that the publisher has removed the file from their server.
You are allowed to download the files provided on this website for personal or commercial use, subject to the condition that they are used lawfully. All files are the property of their respective owners.
The content on the website is provided AS IS for your information and personal use only. It may not be sold, licensed, or shared on other websites without obtaining consent from the author.
Lloyds of London Plot: As a young lad, Jonathan Blake and his friend Horatio Nelson come across an insurance fraud. Jonathan travels to London to visit Lloyd's coffee house, where various syndicates insure shipping ventures. Jonathan's information saves the syndicates a good deal of money and as his reward he asks only that he be allowed to learn the trade. As an adult he becomes a successful insurance underwriter and his syndicate becomes quite profitable. A crisis occurs when they learn that 63 ships were sunk off the Azores by Napoleon's navy. Insurance rates rise dramatically and ship owners refuse to go to sea. Jonathan proposes that they use the old rates in order to ensure Nelson can use his fighting ships in battle and not as convoy ships. Nelson's victory at Trafalgar means the British navy will use the seven seas. Blake is in love with an aristocratic woman whose husband seriously injures him. Blake's friendship with Lord Nelson provides the basis for Blake's part in the growth of Lloyd's insurance business following the Battle of Trafalgar. Only very slightly based on history. 2
Lloyds of London Corporate History First mention February 1688 Edward Lloyd s Coffee House in Tower Street 1730 s Lloyd s begins to dominate shipping insurance 1757 Underwriting first appeared, with actual records of a Quaker businessman s journal stating he went to Lloyd s coffee House and subscribed the book at two guineas a year. 1811 The creation of Lloyd s Agency By 1811, the complexity of the information used by the insurance industry had evolved significantly, but it was the creation of a network of Agents by Lloyd s which profoundly accelerated both the reach and impact of that information. For the first time, a global network of individuals could act as the eyes and ears of the market, finding out the truth, detecting problems and suggesting solutions. The flow of information they sent back to Lloyd s was a vital component of the consolidation and growth of both Lloyd s reputation and the added values and expertise it could offer customers. 1905- Non-Marine lines of coverage appeared, as well as risk-based pricing. 1928-Lloyd s moved into their first building at 12 Ludenhall Street 1965-Lloyd s first admitted foreign members 1998-The government announced that Lloyd s would no long be self-regulated and would be subject to oversight by the new Financial Services Authority 2008-Lloyd s Act amended Historic amendments to the Lloyd s Act modernised elements of the way the market would be governed and removed unnecessary restrictions on how Lloyd s organised its affairs. These included doing away with the requirement that risks had to be placed via a Lloyd s broker and ending rules preventing brokers from owning managing agents. 3
P/C Insurance Industry Outlook Focus on Claims Trends March 23, 2018 Robert P. Hartwig, Ph.D., CPCU Clinical Associate Professor of Finance, Risk Management & Insurance Darla Moore School of Business University of South Carolina Robert.Hartwig@moore.sc.edu 803.777.6782
P/C Insurance Industry Financial Overview CATS Claims, Non-CAT Underwriting Losses in Personal and Commercial Auto Impacted Insurer Balance Sheets Industry Remains Strong, But Major Differences Between Personal and Commercial Lines Growth Prospects 5 5
P/C Industry Net Income After Taxes 1991 2017E 2005 ROE*= 9.6% 2006 ROE = 12.7% 2007 ROE = 10.9% 2008 ROE = 0.1% 2009 ROE = 5.0% 2010 ROE = 6.6% 2011 ROAS1 = 3.5% 2012 ROAS1 = 5.9% 2013 ROAS1 = 10.2% 2014 ROAS1 = 8.4% 2015 ROAS = 8.4% 2016 ROAS = 6.2% 2017E ROAS =4.2%* $ Millions Net income fell sharply in 2017 as high CAT losses took their toll $80,000 $65,777 $63,784 $62,496 $56,826 $55,870 $70,000 $60,000 $44,155 $42,609 $38,501 $36,819 $50,000 $35,204 $33,522 $30,773 $30,029 $29,803 $28,672 $40,000 $24,404 $21,865 $20,598 $20,559 $19,316 $19,456 $30,000 $14,178 $10,870 $20,000 $5,840 $3,046 $3,043 $10,000 $0 -$6,970 -$10,000 91 92 93 94 95 96 97 98 99 00 01 02 03 04 05 06 07 08 09 10 11 12 13 14 15 16 17E ROE figures are GAAP; 1Return on avg. surplus. Excluding Mortgage & Financial Guaranty insurers yields a 8.2% ROAS in 2014, 9.8% ROAS in 2013, 6.2% ROAS in 2012, 4.7% ROAS for 2011, 7.6% for 2010 and 7.4% for 2009; 2016E is annualized figure based actual figure through Q3 of $31.8B. Sources: A.M. Best, ISO; USC RUM Center estimate (2017 based on actual NIAT of $22.352 though Q3 and ROAS of 4.2%).
Profitability Peaks & Troughs in the P/C Insurance Industry, 1975 2017:Q3 ROEs in 2017 plunged to their lowest levels since 2001 and 9/11. This creates extreme pricing pressure. ROE 1977:19.0% 1987:17.3% 25% 20% 2006:12.7% 1997:11.6% 2015: 8.4% 15% 2013 9.8% 9 Years 10% 5% 2016 6.2% 0% 2017E 4.2% 1975: 2.4% 1984: 1.8% 1992: 4.5% 2001: -1.2% -5% 17* 75 76 77 78 79 80 81 82 83 84 85 86 87 88 89 90 91 92 93 94 95 96 97 98 99 00 01 02 03 04 05 06 07 08 09 10 11 12 13 14 15 16 *Est. for 2017 based on actual ROAS of 4.45 through Q2; Profitability = P/C insurer ROEs. 2011-16 figures are estimates based on ROAS data. Note: Data for 2008-2014 exclude mortgage and financial guaranty insurers. Source: NAIC, ISO, A.M. Best, Conning, USC RUM Center estimates.
ROE: Property/Casualty Insurance by Major Event, 1987 2017E (Percent) P/C Profitability Is Influenced Both by Cyclicality and Volatility 20% Harvey, Irma, Maria, CA Wildfires Katrina, Rita, Wilma Low CATs 15% 10% Sept. 11 5% Hugo Lowest CAT Losses in 15 Years Sandy 4 Hurricanes Andrew, Iniki 0% Record Tornado Losses Northridge Financial Crisis* -5% 87 88 89 90 91 92 93 94 95 96 97 98 99 00 01 02 03 04 05 06 07 08 09 10 11 12 13 14 15 16 17* *2017 Estimate based on actual ROAS through Q3 of 4.2% with USC Center for Risk and Uncertainty Management estimate for the full year. Excludes Mortgage & Financial Guarantee in 2008 2014. Sources: ISO, Fortune; USC RUM Center. 8
P/C Insurance Industry Combined Ratio, 2001 2017:Q3* Heavy Use of Reinsurance Lowered Net Losses Higher CAT Losses, Shrinking Reserve Releases, Toll of Soft Market Relatively Low CAT Losses, Reserve Releases As Recently as 2001, Insurers Paid Out Nearly $1.16 for Every $1 in Earned Premiums Sharply higher CATs are driving large underwriting losses and pricing pressure Relatively Low CAT Losses, Reserve Releases Avg. CAT Losses, More Reserve Releases 120 115.8 Best Sandy Impacts Cyclical Deterioration Combined Ratio Since 1949 (87.6) 110 107.5 106.5 Lower CAT Losses 104.1 102.5 101.1 101.0 100.8 100.7 100.1 99.3 98.4 100 96.497.097.8 95.7 92.6 90 01 02 03 04 05 06 07 08 09 10 11 12 13 14 15 16 17E * Excludes Mortgage & Financial Guaranty insurers 2008--2014. Including M&FG, 2008=105.1, 2009=100.7, 2010=102.4, 2011=108.1; 2012:=103.2; 2013: = 96.1; 2014: = 97.0.; 2017 (est.) based on actual 104.1 through Q3 (Q3 combined ratio alone was 110.7). Sources: A.M. Best, ISO (2014-2015); Figure for 2010-2013 is from A.M. Best P&C Review and Preview, Feb. 16, 2016. 9
Commercial Lines Combined Ratio, 1990-2017F* Commercial lines underwriting performance deteriorated materially in 2017 as record CATs. diminishing prior year reserves, rising loss cost trends and pricing pressure in some lines are pushing combined ratios higher 122.3 125 118.8 Commercial Lines Combined Ratio 120 112.5 115 112.3 111.1 110.2 110.2 110.2 109.7 109.5 109.4 107.6 107.3 110 106.2 105.4 105.4 104.4 104.1 103.8 102.5 105 102.0 100.7 99.1 100 96.3 96.0 95.1 94.5 95 91.1 90 90 91 92 93 94 95 96 97 98 99 00 01 02 03 04 05 06 07 08 09 10 11 12 13 14 15 16 17E *2007-2012, 2017 figures exclude mortgage and financial guaranty segments. 17E = actual 9 mo. YTD figure of 106.2. Source: A.M. Best (1990-2016); ISO (2017E). 10
Policyholder Surplus, 2006:Q4 2017:Q3 ($ Billions) $700.9 $717.0 $719.4 Drop due to near-record 2011 CAT losses $676.3 $675.2 $673.9 $674.2 $673.7 $671.6 $700 $662.0 Financial Crisis $653.4 $624.4 $650 $614.0 $607.7 $586.9 $583.5 $566.5 $570.7 $600 $567.8 $559.2 $559.1 $550.3 $544.8 $540.7 $538.6 $530.5 $521.8 $550 $517.9 $515.6 $512.8 $511.5 $505.0 $496.6 $490.8 $487.1 Surplus (Capacity) as of 9/30/17 reached a new record of $719.4B despite record CAT losses $478.5 $500 $463.0 $455.6 $437.1 $450 $400 06:Q4 07:Q1 07:Q2 07:Q3 07:Q4 08:Q1 08:Q2 08:Q3 08:Q4 09:Q1 09:Q2 09:Q3 09:Q4 10:Q1 10:Q2 10:Q3 10:Q4 11:Q1 11:Q2 11:Q3 11:Q4 12:Q1 12:Q2 12:Q3 12:Q4 13:Q1 13:Q2 13:Q3 13:Q4 14:Q1 14:Q2 14:Q3 14:Q4 15:Q2 15:Q4 16:Q1 16:Q4 17:Q2 17:Q4 2010:Q1 data includes $22.5B of paid-in capital from a holding company parent for one insurer s investment in a non-insurance business . Capacity/Capital shocks typically do not on their own drive a sustained firming of the pricing environment Sources: ISO, A.M .Best; 2018 estimate from the Center for Risk and Uncertainty Management, University of South Carolina. 11
Catastrophe Loss Update: Major Driver of Rate Pressure 2017 Was One of the Costliest Years Ever for US Insurers Hurricanes Harvey, Irma and Maria, California Wildfires Exact a Huge Toll 12 12
U.S. Insured Catastrophe Losses, 1989 2017 YTD* 2017 is likely to become the second costliest year ever for insured CAT losses in the US ($ Billions, $ 2015) $90 $77.0 $75.7 $80 $70 $60 $38.9 $50 $36.1 $35.8 $34.7 $34.6 $30.1 $40 $27.2 $21.6 $30 $16.8 $15.5 $15.2 $14.8 $14.9 $14.4 $13.0 $13.1 $11.9 $11.8 $11.3 $10.9 $20 $9.1 $8.2 $7.8 $7.7 $6.3 $5.0 $3.9 $10 $0 89 90 91 92 93 94 95 96 97 98 99 00 01 02 03 04 05 06 07 08 09 10 11 12 13 14 15 16 17* *As of Dec. 31, 2017. Stated in 2017 dollars. Excludes NFIP losses. Note: 2001 figure includes $20.3B for 9/11 losses reported through 12/31/01 ($25.9B 2011 dollars). Includes only business and personal property claims, business interruption and auto claims. Non-prop/BI losses = $12.2B ($15.6B in 2011 dollars.) Sources: Property Claims Service/ISO; Insurance Information Institute. 14 14
Top 10 US Catastrophe Losses of 2017, by Insured Loss (Insured Losses, 2017 Dollars, $ Billions)* YTD insured CAT losses in the US totaled $72 billion by late 2017, the second costliest year on record, led by Hurricanes Maria, Irma and Harvey $25 Not all insured losses in 2017 were due to hurricanes. More than $15B in other losses occurred from coast-to-coast. $21.9 $20 $18.0 $15.9 $15 $10 $7.3 $5 $1.9 $1.6 $1.5 $1.4 $1.3 $1.0 $0 June Hailstorm March Storms February Storms March Storms March Storms May Colorado Storm California Wildfires Hurricane Harvey Hurricane Irma Hurricane Maria *As of Nov. 14, 2017. Sources: PCS; Insurance Insider: http://www.insuranceinsider.com/-1270818/9. 15
Inflation Adjusted U.S. Catastrophe Losses by Cause of Loss, 1997 20161 Other Wind/Hail/Flood (3), Fires (4), $8.4 Other (5), $0.8 $29.7 Insured cat losses from 1997-2016 totaled $421.2B, an average of $21.1B per year or $1.76B per month Winter storm losses were much above average in 2014/15 pushing this share up 0.2% 2.0% Terrorism, $25.0 7.0% 5.9% Winter Storms, $28.2 6.7% 38.2% Hurricanes & Tropical Storms, $161.1 Tornado share of CAT losses is rising Wind losses, by far, cause the most catastrophe losses, even if hurricanes/TS are excluded. 39.9% Events Involving Tornadoes (2), $168.1 1. Catastrophes are defined as events causing direct insured losses to property of $25 million or more in 2016 dollars. 2. Excludes snow. 3. Does not include NFIP flood losses 4. Includes wildland fires 5. Includes civil disorders, water damage, utility disruptions and non-property losses such as those covered by workers compensation. Source: ISO s Property Claim Services Unit. 16
Origins of Pricing Pressure Arising from (Near) Record CAT Activity +10% to +20%* Non-Loss Affected: +5% Loss-Affected: +10% to +15%** 0% to +5% Retrocessional Reinsurance markets (reinsurance for reinsurance companies) are pushing pressure through the reinsurance markets and into both commercial and personal lines *Some programs above and below this range. **Higher end of range applies to loss-affected accounts. Sources: Adapted from Barclay s Capital research. 17
INVESTMENTS: THE NEW REALITY Investment Performance is a Key Driver of Insurer Profitability The Trump Bump Has Lifted Stock Markets and Interest Rates Will the Gains Help Insurers? 21 21
Property/Casualty Insurance Industry Investment Income: 2000 2017E* Investment earnings in 2017E were still ~14% below their 2007 pre-crisis peak ($ Billions) $60 $54.6 $52.3 $51.2 $49.5 $49.2$48.0$47.3$46.4$47.2$46.3$47.2 $50 $47.1$47.6 $39.6 $38.9 $38.7 $40 $37.1$36.7 $30 00 01 02 03 04 05 06 07 08 09 10 11 12 13 14 15 16 17E* Due to persistently low interest rates, investment income fell in 2012, 2013 and 2014 but showed a small (1.7%) increase in 2015 though 2016 experienced another decline. Up ~2% in 2017. 1 Investment gains consist primarily of interest and stock dividends. Sources: ISO; Insurance Information Institute. *2017 estimate based on annualized $35.4B actual figure through Q3 2017.
Change in Commercial Rate Renewals, by Line: 2017:Q3 Commercial Auto was only major line with materially positive renewals in 2017 Percentage Change (%) Commercial Property, Business Interruption will need to reflect record CAT losses and pressure from reinsurance markets 8.0% 7.3% 6.0% 4.0% 2.0% 0.9% 0.7% 0.4% 0.4% 0.1% 0.1% 0.0% -0.4% -0.7% -0.8% -2.0% -2.3% -4.0% Construction General Surety Umbrella Interruption Cyber Commercial Commercial D&O EPL Liability Workers Business Comp Property Auto Note: CIAB data cited here are based on a survey. Rate changes earned by individual insurers can and do vary, potentially substantially. Source: Council of Insurance Agents and Brokers; USC Center for Risk and Uncertainty Management. 24
Commercial Lines NPW Premium Growth: 1975 2017E Commercial lines premium growth has been sluggish for years, reflecting weak pricing environment. Large underwriting losses will necessarily pressure rates upward in 2018 ROE Commercial lines is prone to far more cyclical volatility that personal lines. 35% Economic Shocks, Inflation: 1976: 22.2% 30% Tort Crisis 1986: 30.5% 25% Post-9/11 2002: 22.4% 20% 1988-2000: Period of inter-cycle stability 15% Post-Hurricane Andrew Bump: 1993: 6.3% Post Katrina Bump: 2006: 7.7% 10% 5% 0% -5% 2016: -1.3% 2017: +1.8% Recessions: 1982: 1.1% Great Recession: 2009: -9.0% -10% -15% 17E 75 77 79 81 83 85 87 89 91 93 95 97 99 01 03 05 07 09 11 13 15 Note: Data include state funds beginning in 1998. Source: A.M. Best; Insurance Information Institute. 2017 estimate: Univ. of South Carolina Center for Risk and Uncertainty Management, ISO.
Change in Commercial Rate Renewals, by Line: 2017:Q3 Commercial Auto was only major line with materially positive renewals in 2017 Percentage Change (%) Commercial Property, Business Interruption will need to reflect record CAT losses and pressure from reinsurance markets 8.0% 7.3% 6.0% 4.0% 2.0% 0.9% 0.7% 0.4% 0.4% 0.1% 0.1% 0.0% -0.4% -0.7% -0.8% -2.0% -2.3% -4.0% Construction General Surety Umbrella Interruption Cyber Commercial Commercial D&O EPL Liability Workers Business Comp Property Auto Note: CIAB data cited here are based on a survey. Rate changes earned by individual insurers can and do vary, potentially substantially. Source: Council of Insurance Agents and Brokers; USC Center for Risk and Uncertainty Management. 26
Cyber Liability Coverage for Public Power Utilities Typical cyber policies include: Security & Privacy Liability Multimedia & Intellectual Property Liability Network Interruption & Recovery Privacy Regulatory Defense & Penalties Network Extortion Reputational Damage PCI Fines Unique coverage for Public Power Utilities: Broad definition of computer network to include all SCADA systems and system control rooms Coverage for NERC/FERC fines and penalties 29
D&O Pressure: Number of Federal Securities Class Actions, 2013 2017* Number of Class Actions The number of securities class actions is rising sharply, putting pressure on D&O coverage 400 363 350 300 271 250 207 200 170 165 150 100 50 0 2013 2014 2015 2016 2017 *As of Nov. 16, 2017. Source: Stanford University Law School: http://securities.stanford.edu/
Workers Compensation Combined Ratio: 1994 2016P WC results have improved markedly since 2011 130 121.7 118.2 125 115.3 115.0 115.0 120 112.6 110.6 109.0 108.6 115 107.0 105.1 104.5 103.5 110 102.7 102.0 102.0 101.0 100.0 100.0 105 98.5 97.0 100 94.0 94.0 95 90 85 80 94 95 96 97 98 99 00 01 02 03 04 05 06 07 08 09 10 11 12 13 14 15 16P Workers Comp Is an Example of a Line that Was Recently Restored to Health Through the Return of Rate Adequacy Sources: A.M. Best (1994-2009); NCCI (2010-2016P) and are for private carriers only.. 31
Consulting Services Loss Control Services Risk Management Review Broker Selection Process Self- Insurance Consulting Services Competitive Bidding Process 33
Policy Review The objectives: Complete, objective review of existing insurance coverages Ensure that all insurance policies are adequate and up-to-date Ensure optimal cost efficiency and eliminate coverage gaps Our approach: Collection of corporate policies Review of financials Complete policy analysis Preparation of written evaluation Meet with client to review recommendations Industry benchmarking Client Benefits: Elimination of coverage gaps, duplications, and inefficiencies Peace of mind in knowing that coverages are up to industry standards The optimal insurance policy portfolio at the best possible price Recommendations and strategies to reduce cost of risk 34
Competitive Bidding Process The objectives: Optimal insurance products secured through a comprehensive bidding process Match client insurance needs with optimal market solutions Eliminate the time investment of the client in the selection process Our Approach: Consolidate current policy data Identify brokers to participate Establish optimal coverages/deductibles Prepare specs package Assign markets by broker distribute specs Handle broker questions Analyze submitted bids Meet with client to make selection Client Benefits: Lower cost of insurance with optimum competition Broader coverage without fatal flaws Equitable and professional purchasing process 35
Broker Selection Process The objectives: Ensure you have optimal insurance coverage at the best possible pricing available in the marketplace Partner you with the optimum broker relationship for your needs Peace of mind from making a well-informed decision Our Approach: Identify qualified potential brokers Prepare outline of current program Review current exposures Establish parameters Schedule oral broker presentations Client decision with McNeary input Prepare broker questionnaire Send package to brokers Client Benefits: An optimal politically correct selection decision free of bias or favoritism Significant time and stress savings by outsourcing the evaluation process Peace of mind in selecting the broker that best fits your needs Sound methodology to convert broker compensation from commission to flat fee 36
TPA Review The objectives: Ensure that you have optimal claim handling at the best possible pricing available in the marketplace Partner you with the best TPA relationship for your needs Peace of mind from making a well-informed decision Our Approach: Prepare outline of current program & review selected claim files for best practices Identify qualified potential TPA s Review historical claims date Establish parameters Prepare TPA questionnaire Send package to TPAs Schedule oral presentations Client decision with McNeary input Client Benefits: An optimal politically correct selection decision free of bias or favoritism. Significant time and stress savings by outsourcing the evaluation process. Peace of mind in selecting the TPA that best fits your needs. 37
Ongoing Services The objectives: Identify exposures to loss Examine feasibility of alternative risk management techniques Select best approach Implement selected program Monitor Results Our Approach: Serve as client advocate & facilitator Assemble , analyze, evaluate premium & loss data Claim review & oversight, including loss projections Identify & evaluate exposures Oversee/manage Renewal process Review engineering, recommend actions, negotiate time frames Review loss control/safety programs & make recommendations Check policies, endorsements, audits, etc. Review contracts/hold harmless language Prepare Insurance Reference Manual (IRM) Client Benefits: Unbiased expertise and advice on risk management issues Reduction of cost of risk Reduction in workload related costs Peace of mind regarding coverages vs. exposures Better service from brokers, carriers and other vendors Elimination of coverage gaps, duplications and inefficiencies 38