LLRW Disposal Data Calendar and Volume Summary for Appalachian Compact 2018
Discover the Appalachian Compact's data on Low-Level Radioactive Waste (LLRW) disposal in 2018, including volume by state and facility type, activity by state and facility type, and volume trends from 1998 to 2018. Delve into the specifics of LLRW disposal in various states and facility types, presented in a comprehensive manner for environmental awareness and analysis.

Download Presentation

Please find below an Image/Link to download the presentation.
The content on the website is provided AS IS for your information and personal use only. It may not be sold, licensed, or shared on other websites without obtaining consent from the author. If you encounter any issues during the download, it is possible that the publisher has removed the file from their server.
You are allowed to download the files provided on this website for personal or commercial use, subject to the condition that they are used lawfully. All files are the property of their respective owners.
The content on the website is provided AS IS for your information and personal use only. It may not be sold, licensed, or shared on other websites without obtaining consent from the author.
E N D
Presentation Transcript
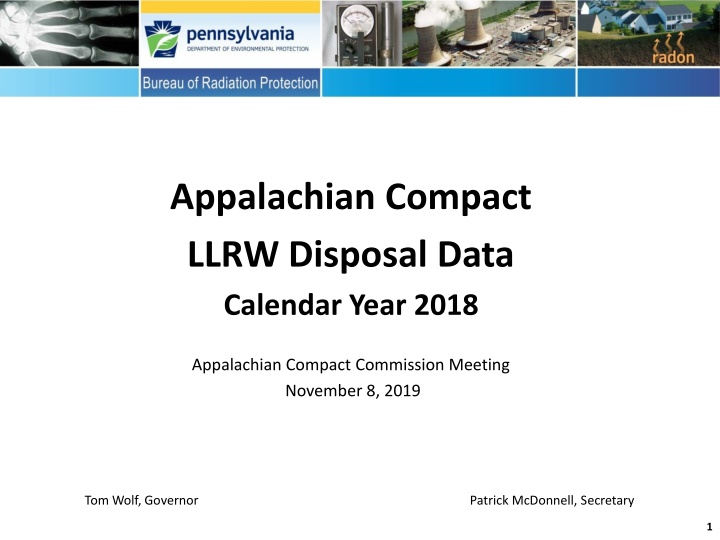
Appalachian Compact LLRW Disposal Data Calendar Year 2018 Appalachian Compact Commission Meeting November 8, 2019 Tom Wolf, Governor Patrick McDonnell, Secretary 1
Appalachian Compact Disposed LLRW Volume by State and Facility Type - 2018 WV WV DE DE MD MD PA PA Total Total Facility Type/State Facility Type/State 13.0 0 0.70 28.92 42.62 Academic Academic 4.0 0 615.40 219,321 219,940 Government Government 0 0 1,907 72,479 74,386 Industry Industry 0 0 10.00 9.73 19.73 Medical Medical 0 0 2,966 46,830 49,796 Utility Utility 17.0 0 5,499 338,668 344,184 Total Total Volume is in cubic feet. This data is for LLRW disposal at EnergySolutions in Clive, Utah, and Waste Control Specialists in Andrews, Texas, for the calendar year 2018. 2
Appalachian Compact Disposed LLRW Volume by State and Facility Type - 2018 350,000.0 300,000.0 250,000.0 Volume Cubic Feet 200,000.0 150,000.0 Total 100,000.0 PA MD 50,000.0 DE WV 0.0 Academic Government Industry Medical Utility Total WV DE MD PA Total 3
Appalachian Compact Disposed LLRW Activity by State and Facility Type - 2018 WV WV DE DE MD MD PA PA Total Total Facility Type/State Facility Type/State 0.01 0 0.00045 0.02 0.03 Academic Academic 0.00119 0 49.06 0.42 49.48 Government Government 0 0 0.12 42.04 42.16 Industry Industry 0 0 0.01 0.15 0.16 Medical Medical 0 0 76.12 41,986.72 42,063 Utility Utility 0.01 0 125.31 42,029.35 42,155 Total Total Activity is in curies. This data is for LLRW disposal at EnergySolutions in Clive, Utah, and Waste Control Specialists in Andrews, Texas, for the calendar year 2018. 4
Appalachian Compact Disposed LLRW Activity by State and Facility Type - 2018 45,000 40,000 35,000 30,000 Activity Curies 25,000 20,000 Total 15,000 PA 10,000 MD DE 5,000 WV 0 Academic Government Industry Medical Utility Total WV DE MD PA Total 5
Appalachian Compact Disposed LLRW Volume in Cubic Feet from 1998 to 2018 Year 1998 1999 2000 2001 2002 2003 2004 2005 2006 2007 2008 2009 * 2010 * 2011 * 2012 * 2013 * 2014* * 2015* * 2016* * 2017* * 2018* * WV DE MD PA Total 48.0 158.7 53.4 44.1 183.3 151.8 34.8 2.4 38.0 48.7 132.2 134.1 11.3 19.1 21.0 44.8 24.8 19.0 1.8 0.68 17.0 173.8 80.6 27.6 76.2 366.4 73.5 48.8 74.2 59.2 42.7 414.8 431.2 29.4 1,061.0 75.2 339.5 42.7 45.2 7,604.6 8,406.8 9,766.8 10,759.9 6,752.8 3,703.1 13,177.8 107,956.4 48,131.8 21,015.6 6,702.5 21,451.3 22,957.6 10,568.7 12,364.3 23,597.2 72,334.3 18,202.9 7,351.0 6,588.0 5,498 442,891.40 42,686.0 143,043.7 421,398.1 534,429.4 55,371.4 74,901.0 55,136.0 91,292.6 57,627.7 78,454.5 113,483.2 103,666.9 76,519.4 155,508.5 122,380.2 72,066.9 56,040.4 91,222.9 237,692.0 489,265.90 338,668 3,410,856.70 50,512.4 151,689.8 431,245.9 545,309.6 62,673.9 78,829.4 68,397.4 199,325.6 105,856.7 99,561.5 120,732.7 125,683.5 99,517.7 167,157.3 134,840.7 96,048.4 128,442.2 109,490.0 245,049.0 495,888.71 344,184 Grand Total 3,860,436.41 4.5 34.13 0 1,188.98 3,500.63 Total * 2009 to 2013 LLRW volume only includes disposal at EnergySolutions in Clive, Utah. ** 2014 to 2018 includes disposal at EnergySolutions in Clive, Utah, and Waste Control Specialists in Andrews, Texas. Years 1998 to 2008 include disposal at Barnwell, South Carolina, and Energy Solutions, Clive, Utah. 6
Appalachian Compact Disposed LLRW Volume in Cubic Feet from 1998 to 2018 550,000 500,000 450,000 400,000 350,000 Cubic Feet 300,000 250,000 200,000 150,000 100,000 50,000 0 1998 1999 2000 2001 2002 2003 2004 2005 2006 2007 2008 2009 2010 2011 2012 2013 2014 2015 2016 2017 2018 Year MD WV DE PA Total 7
Appalachian Compact Disposed LLRW Activity in Curies from 1998 to 2018 Year 1998 1999 2000 2001 2002 2003 2004 2005 2006 2007 2008 2009 * 2010 * 2011 * 2012 * 2013 * 2014 ** 2015 ** 2016** 2017** 2018** WV DE MD PA Total 37.3 0.5 2.2 0.03 0.1 0.2 0.8 0.7 0.03 0.2 0.1 0.02 0.01 0.02 0.003 0.01 0.002 0.02 0.35 0.00001 0.01 0.1 0.1 0.02 0.03 0.5 24.7 0.2 31.3 11.9 12.9 12.2 0.5 0.03 1.0 0.01 45.3 0.01 0.007 0.014 0.0017 531.5 1,335.7 484.0 903.3 244.5 166.3 11,830.7 156.8 60.1 25,304.7 2,181.5 43,691.0 86,618.0 357,624.4 168,919.6 6,777.4 241,649.8 18,890.3 58,786.2 91,719.1 492,579.3 283,328.8 1,001.4 656.8 492.6 449.3 458.5 1,212.8 4,147.3 2,020.93 1,714.26 42,029.35 44,259.9 87,954.3 358,110.7 169,822.9 7,022.5 241,840.9 30,722.0 58,974.9 91,791.1 517,897.0 285,522.6 1,006.6 658.2 495.5 451.4 519.5 1,473.5 4,175.2 2,230.29 1,892.78 42,155 4.7 1.4 1.8 2.1 15.7 260.7 27.8 209 178.52 125.31 0 Total 42.61 140.82 44,026 1,904,767 Grand Total 1,948,977 * 2009 to 2013 LLRW activity only includes disposal at EnergySolutions in Clive, Utah. ** 2014 to 2018 includes disposal at EnergySolutions in Clive, Utah, and Waste Control Specialists in Andrews, Texas. Years 1998 to 2008 include disposal at Barnwell, South Carolina, and EnergySolutions, Clive, Utah. 8
Appalachian Compact Disposed LLRW Activity in Curies from 1998 to 2018 600,000 500,000 400,000 Curies 300,000 200,000 100,000 0 1998 1999 2000 2001 2002 2003 2004 2005 2006 2007 2008 2009 2010 2011 2012 2013 2014 2015 2016 2017 2018 Year MD WV DE PA Total 9
Appalachian Compact Disposed LLRW Activity in Curies from 2010 to 2018 45,000 40,000 35,000 30,000 25,000 Curies Total 20,000 PA 15,000 MD 10,000 DE 5,000 WV 0 Year 10
Appalachian Compact Percent Disposed LLRW Volume by Disposal Site - 2018 584.70 cubic feet, 0.17% 343,600 cubic feet, 99.83% EnergySolutions EnergySolutions WCS 11
Appalachian Compact Percent Disposed LLRW Activity by Disposal Site - 2018 2,139 Curies, 5% 40,016 Curies, 95% EnergySolutions EnergySolutions WCS 12
Thank you. Questions? Rich Janati Chief, Division of Nuclear Safety Administrator, Appalachian Compact Comm. Phone: 717-787-2163 rjanati@pa.gov 13