Load Impact Protocols Workshop Summary: Learn about Enersponse, a Demand Response Aggregator managing thousands of water pumping locations in North America, and their participation in California Demand Response programs. Explore event participation a
Discover Enersponse, a leading Demand Response Aggregator and Auto-DR Integrator managing diverse water pumping locations. Dive into their participation in California Demand Response programs, event details, load impact by type, and ex-post analysis methodology for the 2022 program year.

Download Presentation

Please find below an Image/Link to download the presentation.
The content on the website is provided AS IS for your information and personal use only. It may not be sold, licensed, or shared on other websites without obtaining consent from the author. If you encounter any issues during the download, it is possible that the publisher has removed the file from their server.
You are allowed to download the files provided on this website for personal or commercial use, subject to the condition that they are used lawfully. All files are the property of their respective owners.
The content on the website is provided AS IS for your information and personal use only. It may not be sold, licensed, or shared on other websites without obtaining consent from the author.
E N D
Presentation Transcript
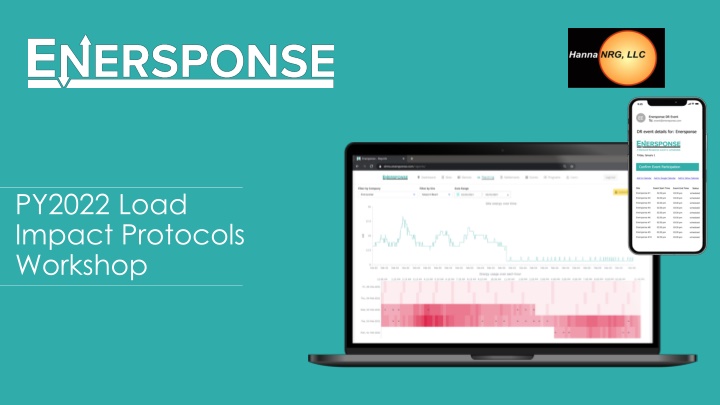
PY2022 Load Impact Protocols Workshop
About Enersponse is a Demand Response Aggregator, and Auto-DR Integrator, managing nearly 18,000 commercial, industrial, agricultural and municipal water pumping locations across North America. Enersponse manages customer participation by way of their DERMs platform, connecting to end-use customer controls via a library of software integrations, including custom API s and OpenADR. While some Enersponse customers are dispatched using traditional methods (email & sms/text notifications) most of their resources are direct-control. Enersponse has been actively participating in various California Demand Response programs since 2015. The customer accounts included in this report have been actively managed by Enersponse in California demand response programs during 2022 program year.
EVENTS & DISPATCH Duration Event Day Event Start Event End # Of Accts 3 hrs. 6/23/2022 5:00 PM 8:00 PM 430 3 hrs. 7/20/2022 5:00 PM 8:00 PM 453 2 hrs. 7/28/2022 3:00 PM 6:00 PM 596 3 hrs. 8/17/2022 5:00 PM 8:00 PM 647 3 hrs. 8/24/2022 5:00 PM 8:00 PM 417 4 hrs. 8/25/2022 4:00 PM 8:00 PM 417 3 hrs. 9/6/2022 5:00 PM 8:00 PM 737 4 hrs. 9/7/2022 4:00 PM 8:00 PM 700 3 hrs. 9/8/2022 4:00 PM 7:00 PM 706 4 hrs. 9/30/2022 4:00 PM 8:00 PM 614
EVENT PARTICIPATION BY LOAD TYPE Event HVAC Pumping Total 06/23/2022 5-8pm 238 192 430 07/20/2022 5-8pm 273 180 453 07/28/2022 3-6pm 397 199 596 08/17/2022 5-8pm 435 212 647 08/24/2022 5-8pm 273 144 417 08/25/2022 4-8pm 0 417 417 09/06/2022 5-8pm 518 219 737 09/07/2022 4-8pm 261 439 700 09/08/2022 4-7pm 512 194 706 09/30/2022 4-8pm 261 353 614
EX POST METHODOLOGY Enersponse has elected to use performance results from its clients in California that have participated in the 2022 program year. For the ex-post analysis, baseline loads were estimated using individual regression modeling. Different model configurations were tested for accuracy and bias to determine the best fit within building type groups. The best model was then estimated for each individual account within each building type group. Once the individual account baselines were calculated, the load impacts were calculated by subtracting the baseline loads in each hour from the actual load in that hour during the event.
COMBINED EX POST # Of Accts Mean Reference Load (kW) Mean Customer Impact (kW) Relative Curtailment Ave Event Hour Temp (oF) Event 06/23/2022 5-8pm 430 250.9 89.1 35.5% 84.2 07/20/2022 5-8pm 453 265.4 95.9 36.1% 85.9 07/28/2022 3-6pm 596 193.0 74.6 38.7% 86.8 08/17/2022 5-8pm 647 167.5 59.1 35.3% 86.0 08/24/2022 5-8pm 417 200.0 80.0 40.0% 83.8 08/25/2022 4-8pm 417 124.4 39.2 31.5% 86.0 09/06/2022 5-8pm 737 143.9 41.9 29.1% 91.7 09/07/2022 4-8pm 700 115.9 61.0 52.6% 91.9 09/08/2022 4-7pm 706 136.9 38.4 28.1% 94.6 09/30/2022 4-8pm 614 115.3 52.7 45.7% 74.1
AVERAGE IMPACTS JUNE 23, 2022 Estimated Reference Load (MW) Observed Event Day Load (MW) Impact 140 120 Event Start Time: 17:00 100 80 Event End Time: 20:00 Load 60 40 20 0 -20 1 2 3 4 5 6 7 8 9 10 11 12 13 14 15 16 17 18 19 20 21 22 23 24 Hour Ending
AVERAGE IMPACTS SEPTEMBER 30, 2022 Estimated Reference Load (MW) Observed Event Day Load (MW) Impact 120 100 Event Start Time: 16:00 80 Event End Time: 20:00 60 Load 40 20 0 -20 -40 1 2 3 4 5 6 7 8 9 10 11 12 13 14 15 16 17 18 19 20 21 22 23 24 Hour Ending
PUMPING IMPACTS TYPICAL 2022 EVENT Estimated Reference Load (MW) Observed Event Day Load (MW) Impact 100 80 60 Load 40 20 0 -20 1 2 3 4 5 6 7 8 9 10 11 12 13 14 15 16 17 18 19 20 21 22 23 24 Hour Ending
HVAC IMPACTS TYPICAL 2022 EVENT Estimated Reference Load (MW) Observed Event Day Load (MW) Impact 40 35 30 25 20 Load 15 10 5 0 -5 1 2 3 4 5 6 7 8 9 10 11 12 13 14 15 16 17 18 19 20 21 22 23 24 Hour Ending
EX ANTE METHODOLOGY The ex-ante load impacts were estimated for the DR resource for typical event days and monthly peak days from 2023 through 2033. The ex-ante analysis used a similar method as the ex-post. Baseline loads and average hourly impacts were estimated using individual regression modeling. Different model configurations were tested for accuracy and bias to determine the best fit within building type groups. The best model was then estimated for each individual account within each building type group. Once the individual account models were estimated, the baselines and the load impacts were simulated based on the regression coefficients and the forecasted weather for the future events.
ENROLLMENT FORECATS (H/M/L) Year 2023 2024 2025 2026 2027 2028 2029 2030 2031 2032 2033 HVAC 1,267 1,622 2,045 2,534 3,092 3,710 4,377 5,078 5,788 6,482 7,130 Pumping Total 2,935 3,757 4,736 5,870 7,163 8,594 10,140 11,763 13,409 15,019 16,522 1,668 2,135 2,691 3,336 4,071 4,884 5,763 6,685 7,621 8,537 9,392
EX-ANTE BY END-USE AUGUST PEAK DAY2023 Percent Impact (%) CAISO Peak Utility Peak Mean Impact (kW) Aggregate Impact (MW) # Of End-use Accounts 1-in-2 1-in-10 1-in-2 1-in-10 HVAC 1,267 2.6 3.2 3.3% 3.2% 3.2% 3.1% Pumping 1,668 53.6 89.3 31.1 31.0 31.1 31.0 Total 2,935 31.5 92.6 24.0 23.7 23.9 23.7
EX-ANTE PUMPING AUGUST PEAK DAY 2023 Estimated Reference Load (MW) Estimated Event Day Load (MW) Impact 400 350 300 250 Load 200 150 100 50 0 1 2 3 4 5 6 7 8 9 10 11 12 13 14 15 16 17 18 19 20 21 22 23 24 Hour Ending
EX-ANTE HVAC AUGUST PEAK DAY 2023 Estimated Reference Load (MW) Estimated Event Day Load (MW) Impact 120 100 80 60 Load 40 20 0 1 2 3 4 5 6 7 8 9 10 11 12 13 14 15 16 17 18 19 20 21 22 23 24 -20 Hour Ending
EX-ANTE BY LCA AUGUST PEAK DAY 2023 Percent Impact (%) CAISO Peak Utility Peak Mean Impact (kW) Aggregate Impact (MW) # Of LCA Accounts 1-in-2 1-in-10 1-in-2 1-in-10 Big Creek / Ventura 435 32.2 14.0 21.5 21.3 21.5 21.3 LA Basin 2,500 31.4 78.6 24.5 24.2 24.4 24.2 Total 2,935 31.5 92.6 24.0 23.7 23.9 23.7
EX-ANTE TYPICAL EVENT IMPACT FORECAST Year 2023 2024 2025 2026 2027 2028 2029 2030 2031 2032 2033 HVAC (MW) 3.2 4.1 5.2 6.5 7.9 9.5 11.1 12.9 14.7 16.5 18.2 Pumping (MW) 89.3 114.3 144.1 178.7 218.0 261.6 308.7 358.0 408.1 457.2 502.9 Total (MW) 92.6 118.5 149.3 185.1 225.9 271.1 319.8 371.0 422.9 473.7 521.1
FUTURE RECOMMENDATIONS It has been challenging to develop accurate and unbiased reference loads for customers with pumping loads. These customers tend to be irregular in their load levels and the timing of the changes in load are difficult to predict. However, in aggregate the individual regression baselines are reasonably accurate. Future evaluations will continue to seek to improve the estimation of the individual baselines.


")