Long-term GHG Abatement & Carbon Pricing in Korea
Korea's plans to reduce greenhouse gas emissions, transition to clean energy, and ensure stability in electricity supply and demand through initiatives like the 8th Basic Plan for Long-term Electricity Supply and Demand. The country aims to decrease emissions by 37% from BAU levels by 2030. Explore the key factors, targets, and strategies driving Korea's shift towards a sustainable energy future.

Download Presentation

Please find below an Image/Link to download the presentation.
The content on the website is provided AS IS for your information and personal use only. It may not be sold, licensed, or shared on other websites without obtaining consent from the author.If you encounter any issues during the download, it is possible that the publisher has removed the file from their server.
You are allowed to download the files provided on this website for personal or commercial use, subject to the condition that they are used lawfully. All files are the property of their respective owners.
The content on the website is provided AS IS for your information and personal use only. It may not be sold, licensed, or shared on other websites without obtaining consent from the author.
E N D
Presentation Transcript
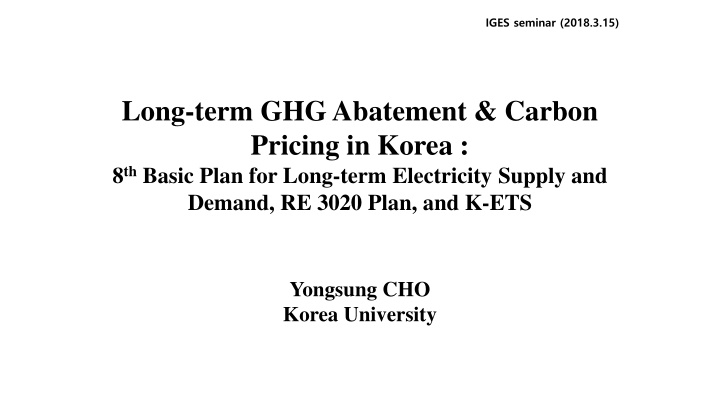
IGES seminar (2018.3.15) Long-term GHG Abatement & Carbon Pricing in Korea : 8thBasic Plan for Long-term Electricity Supply and Demand, RE 3020 Plan, and K-ETS Yongsung CHO Korea University
Transition to clean and safe future energy Korea s Mitigation Target Korea plans to reduce its greenhouse gas emissions by 37% from the business-as-usual (BAU, 850.6 MtCO2eq) level by 2030 across all economic sectors. 11.3% purchase credits from other ETS markets
Unit: MtCO2e Target on 2020 BAU on 2030 Target on 2030
Basic Plan for Long-term Electricity Supply & Demand (BPE) Who : Ministry of Trade, Industry and Energy (MOTIE) When : biennial (15 years period) 1st: 2002~2015 & 8th: 2017~2031 What Basic directions for electricity supply and demand long-term outlook for electricity supply and demand, plans for generation facilities, transmission facilities, and transformation facilities & electricity demand management Procedure Electricity Policy Review Board Meeting Electricity Supply-Demand Committee Meeting & Subcommittee Meeting BPE preparation Public hearing & Report to the e National Assembl Standing Committee Electricity Policy Review Board Review & announcement
Why do we need BPE? Stability of Electricity Supply and Demand Electricity consumption per capita: 859 kWh (1980) 9,555 kWh (2015) unit 1980 1990 2000 2009 2016 Peak demand MW 5,457 17,252 41,007 66,797 84,612 Installed capacity MW 9,391 21,021 48,451 73,470 102,722 Capacity Reserve Electricity consumption per capita % 72.1 21.8 16.8 9.8 21.4 kWh/yr 859 2,206 5,067 8,092 9,555* * In 2015
Characteristics of 8thBPE Period: 2017~2031 (a 15-year long-term plan) Key points : It reflects environmental & safety factors in addition to stable power supply & economic efficiency Peak electricity demand is 100.5 GW in 2030, which is down 11% from the forecast of 113.2 GW in 7thBPE
Characteristics of 8thBPE Produce more power from renewable energy sources and natural gas, while gradually reducing its reliance on coal and nuclear power. The installed capacity of renewables would increase to 58.5 GW from the current 11.3 GW with the growth mainly coming from solar and wind power. The total capacity of LNG power plants would expand to 47.5 GW from 37.4 GW, and those of coal-fired power plants grow to 39.9 GW from 36.8 GW. The installed capacity of nuclear power generation would contract to 20.4 GW from 22.5 GW as five new reactors would enter operation and 11 aging reactors would be taken offline during the period. Renewable energy would account 33.7% of the installed capacity in 2030. The target reserve margin for 2030 is set at 22%.
Share of Installed Capacity and Generation by Type (unit: %) 2017 2030 Share of installed capacity Share of installed capacity Share of generation Share of generation Nuclear 19.3 30.3 11.7 23.9 Coal 31.6 45.3 14.6 36.1 LNG 31.9 16.9 28.9 18.8 Renewable 9.7 6.2 45.2 20.0 other 7.5 1.3 3.7 1.2 The government also aims to generate 20 percent of electricity from renewable energy sources by 2030. The share of natural gas is expected to be 18.8 percent, while those of coal and nuclear power are 36.1 percent and 23.9 percent, respectively.
Meanwhile, current status of renewable energy is
(Renewable Energy) 6.2% of generation output and 9.7% of installed capacity in 2017. Target : (Renewable Energy) 20% of generation output in 2030.
Share of generation output of RE (%) 2010 2016 29.3 24.7 17.3 16.7 15.9 14.9 13.9 10.5 10.1 7 6.8 1.2 Germany UK France Japan USA Korea
Relief pitcher (?) : Renewable Energy 3020 Implementation Plan (RE 3020) The government also aims to generate 20 percent of electricity from renewable energy sources by 2030
Measures New renewable energy source power generation Renewable Energy 3020 targets Korea s new renewable energy source power generation rising by 48.7GW by 2030, with an interim goal of it being raised by 12.4GW by 2022. The 2030 target includes respective capacity additions of 30.8GW and 16.5GW from solar and wind. Participation of citizens and local governments to be sought The latest plan will seek to incentivize the participation of citizens and corporations by expanding private solar power facilities in urban areas and expanding solar power generation in rural areas. Officials will also likely select and supply land suitable for such power generation after revising Korea s New Renewable Energy Law next year.
RPS targets for large power-generation players to rise Sizeable powergeneration projects comprise 60% of 48.7GW capacity expansion targeted under the plan, which calls for increased renewable energy power output by gradually raising renewable portfolio standards (RPS) targets ie, mandatory supply ratios for those large firms. New energy business promotion The proposed measures are also meant to strengthen the competitiveness of Korea s renewable energy industry via increased R&D support, with the plan also set to foster the power brokerage market and lead to growth in ESS and fuel cells to encourage distributed power generation
Renewable energy capacity expansion plan 2030 targets Large commercial power-generation projects Solar power generation in rural areas Small solar businesses run by cooperatives Expansion of private solar Total Capacity (GW) 28.8 10.0 7.5 2.4 48.7 59.1% 20.5% 100% Source: MOTIE
Electricity consumption per capita (unit: MWh) Energy self-sufficiency rate in 2012
Trend of GDP per capita & Electricity consumption per capita
K-ETS Key Capping Features Issue Coverage Feature Approximately 67% of national emissions (522 entities in 2015 & 565 in 2016 & 599 in 2017) Covered (because of low electricity prices) Indirect Emissions (e.g., electricity usage) Phases / Allocation Phase I (2015-2017) Phase II (2018-2020) Phase III (2021-2025) 100% free allocation 97% free allocation (& auction) Less than 90% free allocation (& auction) Phase 1 : 23 sub-sectors from steel, cement, petro-chemistry, refinery, power, buildings, waste and aviation sectors. Inclusion thresholds: Company >125,000 tCO2/year, facility >25,000 tCO2/year Practically, different emission reduction factors per sector, which was main reason of 40+ Phase I allocation lawsuits Sectoral covered, thresholds, and Caps
K-ETS Key Capping Features Issue Feature Banking is allowed without any restrictions Banking borrowing Borrowing is allowed only within a single trading phase (maximum of 10% of entity's obligation in 2015. Increased to 20% in 2016 and 2017), but not across phases. In the first compliance year of Phase two (2018), borrowing will be allowed at a maximum of 15% of an entity's obligation. From 2019, the borrowing limit will be affected by how much an entity has borrowed in the past. Qualitative limit: Only domestic credits from external reduction activities implemented by non-ETS entities may be used for compliance. Domestic CDM credits (CERs), and credits from domestically certified projects (Korean Offset Credits) are allowed in the scheme. These credits must be converted to Korean Credit Units (KCUs) of a specified vintage before being used for compliance. Quantitative limit: Up to 10% of each entity's compliance obligation. In Phase two, trades of CERs from international CDM projects developed by domestic companies will be allowed, up to 5% of each entity s emission volume. In Phase three, credits of up to 10% of each entity's compliance obligation with a maximum of 5% coming from international offsets will be allowed. Offsets and credits Phase 1 Phase 2 & 3
K-ETS Emissions / Projections (Unit: 10,000tCO2e) 2015 2016 2017 # of entities Allocations Emissions # of entities Allocations Emissions # of entities Allocations Total 522 53,975 54,265 565 56,742 55,433 599 56,699 Power Generation 15 22,935 23,123 15 23,135 23,744 15 22,656 Steel 36 10,257 10,185 40 10,547 9,907 40 10,923 Cement 22 4,361 4,455 22 4,413 4,613 24 4,439 Petrochemical 84 4,783 4,937 88 5,254 5,139 95 5,149 Oil Refinery 5 1,931 1,872 5 2,395 1,946 5 1,916
Types of Credits Available in K-ETS Korea Allowance Unit (KAU) KAUs are allowances allocated to companies subject to targets under the K-ETS Korea Offset Credit (KOC) KOCs are credits converted from CERs or other offsets approved by the Korean government. KOCs can be traded between both ETS and non-ETS entities, but cannot be traded in the KRX. KOCs cannot be submitted to the government for compliance with K-ETS targets. Korea Credit Unit (KCU) KCUs are credits converted from KOCs. KOCs can be submitted to the Korean government for compliance with K-ETS targets. KOCs can be claimed and traded between ETS entities only, and are allowed to be traded in the KRX. KCUs cannot be converted back to KOCs. Source: http://www.ieta.org/resources/2016%20Case%20Studies/Korean_Case_Study_2016.pdf
Korea Credit Unit (KCU): Korea Offset Credit (KOC) Carbon Price of K-ETS Korea Allowance Unit (KAU) KAU KCU KOC Total cumulative traded 31,639,438 3,051,354 5,582,134 2015 Trade volume (tCO2e) 321,380 920,717 0 Ave. price (won/tCO2e) 8,746 10,672 n.a. 2016 Trade volume 2,526,810 1,883,767 661,822 Ave. price 11,956 16,952 18,316 2017 Trade volume 19,129,445 246,870 4,728,828 Ave. price 20,935 20,133 21,638 (March 2018) KAU17: 22,133 won/tCO2e & KAU18: 22,000 won/tCO2e & offset credits KCU17: 21,800 won/tCO2e & KOC: 23,000 won/tCO2e
Issue : Compensation scheme undermining role of carbon price in power sector Pursuant to the Korea Power Exchange (KPX) s Power Market Operation Rules, Emission Trading Costs for most power plants are compensated at a Standard Price, which roughly means the annual average credit price The 2015 KAU Standard Price was KRW 16,309/tCO2e, while the 2015 Offset Standard Price was KRW 14,466/tCO2e KPX directly compensates utilities of carbon credit purchase prices paid, and such costs are not directly or immediately reflected in wholesale bid prices Switch between gas combined bid prices and coal power prices impossible, although, due to the large spread between power market bid prices of the two sources, fuel switch would anyways be impossible In any case, compensation scheme is undermining role of carbon price, as power generation companies lack strong motivation to reduce emissions Discussions ongoing to reform compensation scheme
Issues of K-ETS Liquidity Shortage Change of ministry in charge of ETS three times since 2015 Market based mechanism in a (previously) government driven economy Lack of experience with energy and environmental commodities (e.g., government controlled wholesale / retail power market, monopoly over LNG imports) Government has not been able to provide answers on how it will achieve its 37% target / 11.3% (96MtCO2e) international credit commitment Linkage Allocation of 2ndPhase (auction & BM)
Issue: Minimizing government intervention in the carbon market : Provisions for price management The Allocation Committee may decide to implement market stabilization measures in the following cases: The market allowance price of six consecutive months is at least three times higher than the average price of the two previous years. The market allowance price of the last month is at least twice the average price of two previous years and the average trading volume of the last month is at least twice the volume of the same month of the two previous years. The average market allowance price of a given month is smaller than 40% of the average price of the two previous years. When it is difficult to trade allowances due to the imbalance of supply or demand. In 2015 and 2016, the price threshold is KRW 10,000 (EUR 7). The stabilization measures may include: Additional allocation from the reserve (up to 25%). Establishment of an allowance retention limit: minimum (70%) or maximum (150%) of the allowance of the compliance year. An increase or decrease of the borrowing limit (currently up to 20%). An increase or decrease of the offsets limit (currently up to 10%). Temporary establishment of a price ceiling or price floor.
Environmentally related taxes & Taxes on energy use Source: OECD Centre for Tax Policy and Administration
Environmentally related taxes & Taxes on energy use Revenue from environmentally related taxes in Korea As a share of GDP, Korea has the 14th highest environmentally related tax revenue. In 2014, environmentally related tax revenues 2.25% of GDP Average among the 39 countries (34 OECD and 5 partner economies) 2% Taxes on energy use represented 60% of total environmentally related tax revenue Average among the 39 countries 70% Taxes on energy use Korea has higher average tax rates on transport fuels (10.43 EUR/GJ) than on fuels used for heating & process purposes (0.46 EUR/GJ) or electricity generation (0.12 EUR/GJ) Korea has the 29th highest tax rate on energy on an economy-wide basis, 1.63 EUR/GJ (average of 34 OECD and 7 partner economies 2.7 EUR/GJ)
Effective Carbon Rates In Korea, 8% of carbon emissions from energy use face no price signal; 92% face a price at or above EUR 5/tCO ; and 16% face a price at or above EUR 30/tCO . This compares to a zero price for 60% of emissions across all countries, a price at or above EUR 5/tCO for 30% and at or above EUR 30/tCO for 10% of emissions. Excluding road use 9% of carbon emissions from energy use in Korea face no price signal 91% face a price at or above EUR 5/tCO 3% face a price at or above EUR 30/tCO . This compares to a zero price for 70% of emissions across all countries, a price at or above EUR 5/tCO for 19% and at or above EUR 30/tCO for 4% of emissions.
CO emissions priced and average rates Korea is subject to the Korean ETS, which had an average permit price of EUR 11 per tonne of CO in 2015. In total, taxes in Korea price 37% of CO emissions from energy use; and the Korean ETS covers 77%. The sectors with the highest tax coverage are road transport (99%) and residential and commercial (85%). The sectors with the highest price coverage by the ETS are industry (91%) and electricity (90%).
Share of emissions priced & average price signals from tax and ETS CO2 Tax ETS Overlap of tax & ETS** Emissions not priced by tax or ES emissions by sector (tCO2) Average price (EUR/tCO2) 22.4 Share of emissions priced 16% Average price (EUR/tCO2) 0.0 Share of emissions priced 0% Agriculture & Fishing Electricity Industry Offroad transport Residential & Commercial Road transport Total* 6,033 0% 84% 255,658 227,906 3,691 56,218 9.9 14.2 100.6 15.7 23% 20% 34% 85% 6.7 6.7 6.7 6.7 90% 91% 32% 87% 21% 19% 11% 77% 8% 8% 45% 5% 84,796 634,329 154.9 23.8 99% 37% 0.0 5.1 0% 77% 0% 22% 1% 8% * Total average prices are weighted by the share of emissions in each sector that is priced. ** Tax and ETS can apply to the same emissions base. The overlap describes % of emissions in a sector that is priced by both tax and ETS SOURCE: OECD Centre for Tax Policy and Administration
Thank you yscho@korea.ac.kr
")


")


")

 6.2% of generation output and 9.7%")
")
 :")
 :")


")


:")