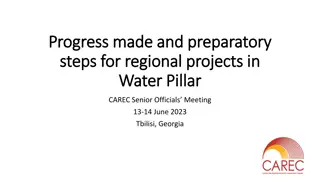
Delivering first-class customer service and ensuring secure, affordable, and sustainable water supplies while focusing on reducing carbon emissions, enhancing infrastructure, and improving the natural environment. Performance metrics and targets to achieve these goals are outlined for 2023 and 2050.
Please find below an Image/Link to download the presentation.
The content on the website is provided AS IS for your information and personal use only. It may not be sold, licensed, or shared on other websites without obtaining consent from the author. If you encounter any issues during the download, it is possible that the publisher has removed the file from their server.
You are allowed to download the files provided on this website for personal or commercial use, subject to the condition that they are used lawfully. All files are the property of their respective owners.
The content on the website is provided AS IS for your information and personal use only. It may not be sold, licensed, or shared on other websites without obtaining consent from the author.
E N D
Presentation Transcript
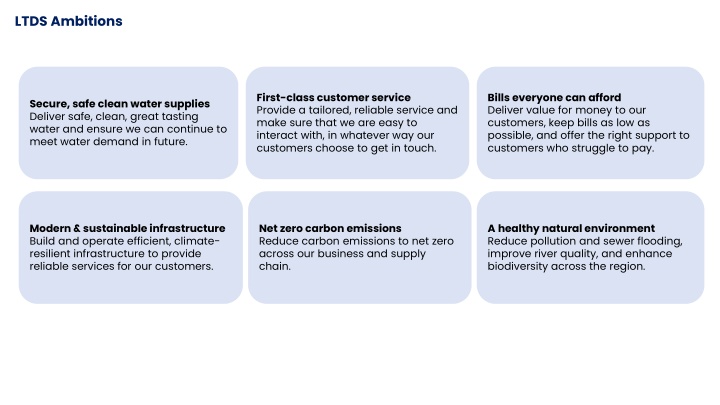
LTDS Ambitions First-class customer service Provide a tailored, reliable service and make sure that we are easy to interact with, in whatever way our customers choose to get in touch. Bills everyone can afford Deliver value for money to our customers, keep bills as low as possible, and offer the right support to customers who struggle to pay. Secure, safe clean water supplies Deliver safe, clean, great tasting water and ensure we can continue to meet water demand in future. Modern & sustainable infrastructure Build and operate efficient, climate- resilient infrastructure to provide reliable services for our customers. Net zero carbon emissions Reduce carbon emissions to net zero across our business and supply chain. A healthy natural environment Reduce pollution and sewer flooding, improve river quality, and enhance biodiversity across the region.
Secure, safe clean water supplies Performance Metric Measure 2023 performance 2050 target Risk of water quality failures To be as close to zero as possible 4.61 0 No. of customers who contact us regarding water quality concerns No. of people who contact us per 10,000 people in Yorkshire 10.2 7.5 Water supply interruptions Average number of mins lost above 3 hrs 9mins 27seconds 30 seconds Measure of resilience to severe droughts 1 in 500-year drought (more resilient) Drought resilience 1 in 330-year drought 110 litres per person per day reduced by educating on water use and smart water meters Customers daily water use Litres used per person per day 123.9 litres per person per day Businesses demand for water millions of litres per day Businesses daily water use 267 million litres per day 236 million litres per day Litres lost per day from our network 282.8 million litres lost per day 150.4 million litres lost per day Leakage
First-Class Customer Service Performance Metric Measure 2023 performance 2050 target Customer experience of our service How we are ranked vs. our peers Upper quartile (one of the top performers) 11th out of 17 companies Developers experience of our service (e.g. housing developers) How we are ranked vs. our peers Upper quartile (one of the top performers) 16th out of 17 companies Businesses experience of our service How we are ranked vs. our peers Upper quartile (one of the top performers) Not currently measured
Bills everyone can afford Performance Metric Measure 2023 performance 2050 target Year on year reduction of the no. of customers in water poverty Reducing the no. of customers in water poverty % of customer who spend more than 5% of their disposable income on YW bill Not currently measured
Modern and sustainable infrastructure Performance Metric Measure 2023 performance 2050 target Internal sewer flooding No. of incidents 546 291 External sewer flooding No. of incidents 5,375 0 Risk of sewer flooding in exceptionally wet weather No. /1,000km clean network No./1,000km waste network The percentage of time our treatment works are down 1 in <30-year event (more frequent risk of flooding) 1 in 30-year event (less frequent risk of flooding) 100 (improved pipes so less repairs needed) 8.2 (improved pipes so less repairs needed) Sewer flooding risk Mains repairs 219.26 Sewer collapses 10.96 Unplanned outage losing your water supply unexpectantly Discharge permit compliance the quality of the water we discharge back in to the environment (rivers & seas) 3.26% 0.9% The percentage of our treatment works that comply with their discharge permits 99.7 100
Net Zero Carbon Emissions Performance Metric Clean Water production Greenhouse gases Measure 2023 performance 2050 target Tonnes of CO2 122,667 0 Wastewater Production Greenhouse gases Tonnes of CO2 159,362 0 Total Greenhouse Gas Emissions Tonnes of CO2 Not currently measured 0
A healthy natural environment Performance Metric Measure 2023 performance 2050 target Eliminate serious pollution incidents New measure 0 0 No. of category minor pollution incidents Eliminate pollution incidents 117 0 Reduce sewage discharges from Storm Overflow to rivers and the coast Average no. of spills across all storm overflows 24 10 Reduce phosphorous in wastewater discharges to rivers % reduction from 2020 0% 80% by 2038 Yorkshire Water aims to ensure their operations have no impact on the quality of bathing waters Bathing water quality beach and rivers No. of bathing waters at good or excellent status 16 No. units created per 100km2 (a unit is a measurement of an areas value to wildlife) 5.02 units per 100km2 of available/suitable land improved Increasing biodiversity growing thriving ecosystems through land management improvements Not currently measured Biodiversity net gain planning application projects that leave the biodiversity in a better state than before the project took place % improvement Not currently measured +10% Blue-green storm overflow solutions (natural rather than concreate tanks) % storm overflow solutions with blue-green component Not currently measured 50%
2025-2030 2030-2035 2035-2040 2040-2045 2045-2050 Water supply improvements (4 new boreholes, 1 new river abstraction, 1 transfer scheme, and increased Water Treatment Works capacity) Smart metering rollout for new and existing customers (most expenditure 2040-2050) Leakage reduction activities to halve leakage by 2050 Water resources Elvington Water Treatment Works to south Yorkshire transfer scheme Improving drinking water taste, odour, and colour by investing in our treatment works (2 sites per 5 yrs ) and cleaning/replacing/lining water pipes (~16 water supply zones per 5 yrs) Drinking water quality Raw water quality monitoring and management (1 scheme per 5 yrs) Removing lead pipes across our network with a focus on lead hotspots and high-risk customers (e.g. schools, communal buildings) Microbiological disinfection treatment of wastewater at our coastal and inland bathing water sites Removing 80% of phosphorus from treated wastewater ( started in 2020) Installing continuous river water quality monitoring equipment Biodiversity conservation activities and river restoration activities, incl. 3-4 fish passes and 1 eel screen per 5 Natural environment yrs Expanding sewers and building tanks to increase wastewater storage capacity and reduce use of storm overflows Wastewater management Managing storm rain-water by creating sustainable drainage solutions such as ponds, wetlands or soakaways Reducing the amount of water entering our wastewater network by separating surface water on roads from sewage water in pipes Developing transfer schemes with other companies and linking water networks to ensure we can supply customers with water at all times Resilience and security Improving the resilience of our wastewater assets to flooding e.g by installing flood barriers (10 sites every 5 yrs) Mitigating cybersecurity risks to our critical infrastructure Switching more of our equipment to renewable energy sources Installing more renewable energy generation equipment at our sites Carbon Investing in new technologies to reduce emissions from wastewater treatment processes 537 644 799 891 917 Bill impact (average per year from 2025-2030) (average per year from 2030-2035) (average per year from 2035-2040) (average per year from 2040-2045) (average per year from 2045-2050)
939 900 900 917 835 891 884 799 697 Natural 618 661 Average 644 561 Increasing Bill ( ) Rising 537 429 429 2025-2030 2030-2035 2035-2040 2040-2045 2045-2050 Bill period