Explore traditional feature-based methods in machine learning with graphs, focusing on edge-level prediction tasks. Learn about distance-based features, local neighborhood overlap, global neighborhood overlap, and more to characterize the structure and connectivity of nodes and edges in networks.
Please find below an Image/Link to download the presentation.
The content on the website is provided AS IS for your information and personal use only. It may not be sold, licensed, or shared on other websites without obtaining consent from the author. If you encounter any issues during the download, it is possible that the publisher has removed the file from their server.
You are allowed to download the files provided on this website for personal or commercial use, subject to the condition that they are used lawfully. All files are the property of their respective owners.
The content on the website is provided AS IS for your information and personal use only. It may not be sold, licensed, or shared on other websites without obtaining consent from the author.
E N D
Presentation Transcript
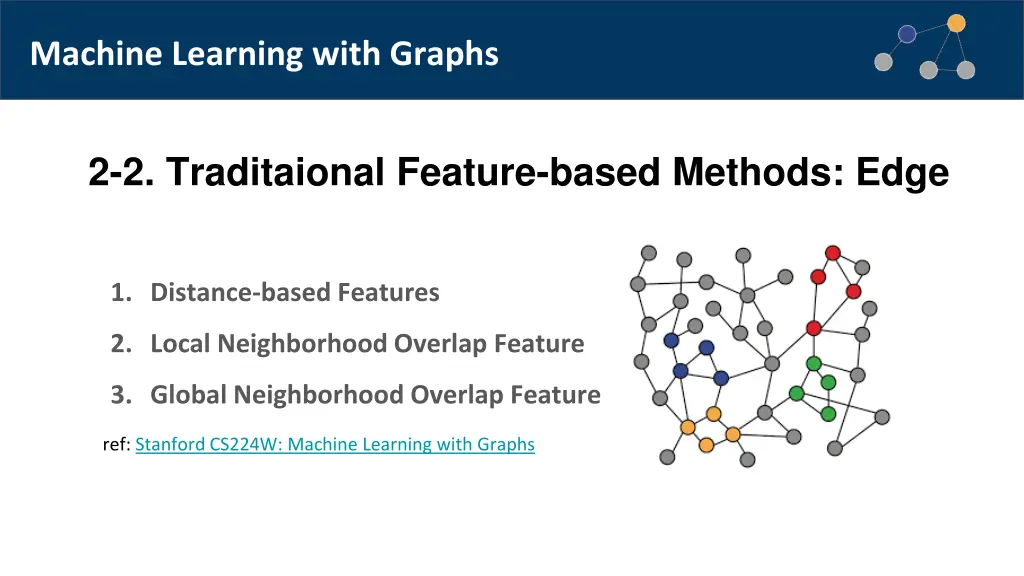
Machine Learning with Graphs 2-2. Traditaional Feature-based Methods: Edge 1. Distance-based Features 2. Local Neighborhood Overlap Feature 3. Global Neighborhood Overlap Feature ref: Stanford CS224W: Machine Learning with Graphs
Edge(Link)-level Prediction Task 1. Predict new links based on existing links. 2. Predict edge-level features/labels e1=5 e1=? e2=3 e2=? training testing t=0 t=1 Multi-moth flame optimization for solving the link prediction problem in complex networks 2
Edge Prediction from Neighborhood High level idea: design features c(x, y) for each node pair (x, y) for example, # of common neighbors 1. select top k pairs as new edges 2. edge_feature(x, y, e) new edge_feature 3
Edge-level Features: Overview Goal: Characterize the structure and connectivity of nodes and edges in the network: Distance-based features Local neighborhood overlap Global neighborhood overlap 4
Distance-based Features Shortest-path distance between two nodes For exmaple: However, this does not capture the degree of neighborhood overlap: Node pair (B, H) has 2 shared neighboring nodes, while pairs (B, E) and (A, B) only have 1 such node. 5
Local Neighborhood Overlap Captures # neighboring nodes shared between two nodes v1 and v2: Common neighbors: Jaccard s coefficient: Adamic-Adar index: 6
Global Neighborhood Overlap Limitation of local neighborhood overlapping features: Metric is always zero if the two nodes do not have any neighbors in common. However, the two nodes may still potentially be connected in the future. Global neighborhood overlap features resolve the limitation by considering the entire graph. 7
Global Neighborhood Overlap: Katz Index Katz index: count the number of walks of all lengths between a given pair of nodes. How to compute number of walks? Powers of the graph adjacency matrix Ai,j = 1 if node i, j are connected 8
Katz Index So, what is number of walks? We want to show: where = #walks of length K between u and v = #walks of length 1 (direct neighborhood) between u and v = 9
Katz Index Using powers of adjacency matrix, we can calculate number of walks of all lengths between a pair of nodes. specifies #walks of length 1 (direct neighborhood) between u and v. specifies #walks of length 2 (neighbor of neighbor) between u and v. specifies #walks of length l. 11
Katz Index Katz index between v1 and v2 is calculated as sum over all walk lengths. Katz index matrix is computed in closed-form: 12
Summary: Ways to Obtain Edge Features Distance-based features: Calculates shortest path between 2 nodes, but cannot capture overlapping neighboods. Local neighborhood overlap: Captures number of sharing neighborhoods between 2 nodes. Only focuses nodes within 2-hop. Global neighborhood overlap: Katz index uses entire graph structure to score 2 nodes. It can capture the structure globally. 13


-level Prediction Task")