Macroeconomic Context for Budget 2025: Overview and Forecasts
GDP declined in 2023, but the underlying economy shows growth potential amidst global challenges. Managing infrastructure bottlenecks, export, and investment issues are key priorities. Inflation is expected to decrease in 2024, supporting real income growth. The labor market remains strong, and public finances are in a healthy state with robust tax revenues.
Download Presentation

Please find below an Image/Link to download the presentation.
The content on the website is provided AS IS for your information and personal use only. It may not be sold, licensed, or shared on other websites without obtaining consent from the author.If you encounter any issues during the download, it is possible that the publisher has removed the file from their server.
You are allowed to download the files provided on this website for personal or commercial use, subject to the condition that they are used lawfully. All files are the property of their respective owners.
The content on the website is provided AS IS for your information and personal use only. It may not be sold, licensed, or shared on other websites without obtaining consent from the author.
E N D
Presentation Transcript
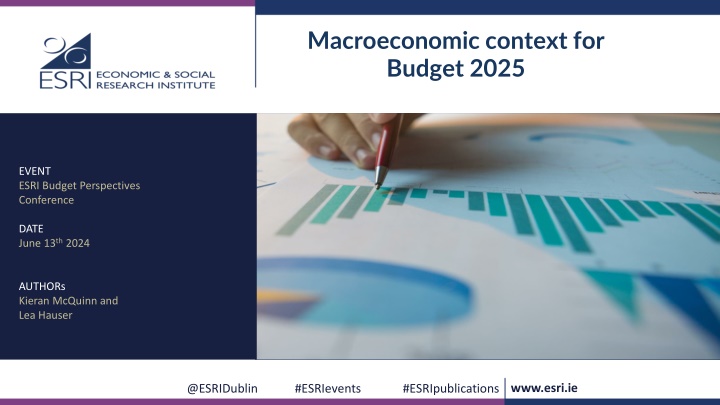
Macroeconomic context for Budget 2025 EVENT ESRI Budget Perspectives Conference DATE June 13th 2024 AUTHORs Kieran McQuinn and Lea Hauser www.esri.ie @ESRIDublin #ESRIevents #ESRIpublications #ESRIevents #ESRIpublications www.esri.ie @ESRIDublin
Overview GDP declined in 2023 while the underlying economy measured by MDD is growing at a moderate pace Global economic conditions deteriorated throughout 2023 due to higher interest rates, persistent inflation, and geopolitical tensions A critical challenge will be managing the Irish economy in the future by dealing with infrastructure bottlenecks Exports and investment levels in the domestic economy have registered negative growth rates in 2023 mainly due to the slowdown specific MNE-related activities Inflation is expected to decline throughout 2024 with a return to growth in real incomes The labour market continues to perform robustly and is now operating close to capacity Public finances continue to be a strong position with growth in income tax and VAT, and levels of corporation tax remaining high 2023 2024 2025 Gross Domestic Product (GDP) -3.2 2.5 2.3 Gross National Product (GNP) 4.4 2.0 1.9 0.5 2.3 2.5 Modified Domestic Demand (MDD) www.esri.ie @ESRIDublin #ESRIevents #ESRIpublications @ESRIDublin #ESRIevents #ESRIpublications www.esri.ie 2
Dual economy on divergent paths GDP & GNP Growth Y-on-Y (%) GVA Growth Y-on-Y (%), Foreign & Domestic Sectors GDP GNP 30% 0.3 20% 0.2 10% 0.1 0% 0 -10% -0.1 -20% -0.2 -30% -0.3 All Foreign GVA Domestic www.esri.ie @ESRIDublin #ESRIevents #ESRIpublications @ESRIDublin #ESRIevents #ESRIpublications www.esri.ie 3 12 March 2025
Nowcast of Modified Domestic Demand 2024Q1 RECENT AND CURRENT MDD NOWCAST (Y-O-Y, %) 5.0 MDD grew by 0.5 per cent in 2023 underlining the moderate performance of the domestic economy 4.0 3.0 Three consecutive quarters of negative y-o-y growth over the period 2023Q2 to 2023Q4 2.0 1.6 This indicator underestimated domestic activity in 2023 (see box explaining this by Egan) 1.0 0.0 We expect MDD to grow by 2.3 per cent in 2024 -1.0 -2.0 2023Q1 2023Q2 2023Q3 2023Q4 2024Q1 (current nc) MDD Actual MDD Nowcast www.esri.ie @ESRIDublin #ESRIevents #ESRIpublications @ESRIDublin #ESRIevents #ESRIpublications www.esri.ie 4
Domestic Spending RETAIL SALES GROWTH ACROSS SUBSECTORS 30.0% 25.0% 20.0% Growth in consumption is moderating with a clear downward trend 15.0% 10.0% 5.0% 0.0% A major factor in the downside pressure on the domestic economy in 2023 has come from inflationary factors eroding the real resources of households -5.0% All Motor Trade & Fuel Food Non Food Savings rates have fallen back to more normal rates (after being elevated following the Covid-19 pandemic) FINAL CONSUMPTION OF HOUSEHOLDS 2023 (Y-O-Y, %) Retail sales show a steady but sustained moderation in expenditure across all activities Sweden Finland Portugal Austria Ireland's surpasses other EU countries, showcasing domestic resilience and robust performance final household consumption growth Netherlands Italy France Spain Ireland Germany Denmark Forecast 2023 2024 2025 Belgium -3.0% -2.0% -1.0% 0.0% 1.0% 2.0% 3.0% 4.0% Private Consumer Expenditure 3.1 2.5 2.7 www.esri.ie @ESRIDublin #ESRIevents #ESRIpublications @ESRIDublin #ESRIevents #ESRIpublications www.esri.ie 5 12 March 2025
Global Trade Slows TRENDS IN EXPORTS (Y-ON-Y, % CHANGE) 0.3 0.2 Global Trade Exports Imports 2023 -4.8 2024 3.3 2025 3.6 0.1 0 -3.0 3.5 3.8 -0.1 -0.2 Export growth from MNE activities has been the cornerstone of the extremely high growth rates of headline indicators in recent years -0.3 Goods Exports International Trade Globalisation Exports Services Computer Services Y-on-Y 2023 Y-on-Y 2022 In 2023, export growth dropped notably by nearly 5%, reversing these trends VALUE OF EXPORTS OF GOODS 70% 60% Irish export performance reversal is mainly due to sector-specific factors and globalization activities 50% 40% 30% 20% 10% 0% -10% The moderation in activity is coming through the goods side which experienced a decline in export volumes of over 12% in 2023 -20% -30% -40% 2022 July 2023 July 2022 January 2023 January 2024 January 2022 February 2022 June 2023 February 2023 June 2022 March 2022 May 2023 March 2023 May 2022 August 2022 November 2023 August 2023 November 2022 October 2023 October 2022 April 2023 April 2022 September 2023 September 2022 December 2023 December Potential recovery for Irish goods exports in 2024 is suggested by January 2024 rebound figures Overall Food Pharma Machinery Miscellaneous www.esri.ie @ESRIDublin #ESRIevents #ESRIpublications @ESRIDublin #ESRIevents #ESRIpublications www.esri.ie 6 12 March 2025
Investment remains muted ANNUAL GROWTH RATES Investments weakened in 2023 due to high financing costs and global uncertainties, which weighed on the business outlook 50% 40% Also multinational-specific effects were evident. 30% Overall investment increased by 3% in 2023 driven by higher intangible asset investment in the last quarter 20% Modified investment fell back by approximately 7% 10% 9% Non-construction investment dropped by 14% and construction investment dropped by 1% 0% -1% -4% -7% In construction, residential dwelling investment increased, while non-dwellings construction decreased -10% -14% -20% Modified Gross Domestic Fixed Capital Formation Modified Investment (excluding construction) Construction Dwellings Non-Dwellings Construction Forecast 2023 2024 2025 Investment 2.9 2.4 3.1 Modified Investment -7.1 2.9 3.2 Y-on-Y 2022 Y-on-Y 2023 www.esri.ie @ESRIDublin #ESRIevents #ESRIpublications @ESRIDublin #ESRIevents #ESRIpublications www.esri.ie 7 12 March 2025
Inflation is moderating Price Developments Inflation (CPI) 2023 2024 2025 Weighted CPI components 6.3 2.3 1.9 10.00% 8.5% Inflation is slowing down quicker than expected 8.00% 7.8% 7.7% 7.2% 6.6% 6.3% 6.4% Energy price growth has been declining over time and is almost back at pre-crisis rates of increase (levels remain much higher) 6.1%5.8% 6.00% 5.1% 4.6% 4.1% 4.00% 3.9% 3.4% 2.9%2.6% The highest y-o-y price increase were in the Restaurant & Hotels , Recreation & Culture and, Transport sector - areas that appear to areas impacted by second round effects of the high energy prices 2.00% 0.00% -2.00% Y-o-y price increase is almost zero in the category Housing, water, electricity, gas and other fuels Food and non-alcoholic beverages Housing & Energy Transport Restaurants and hotels CPI Alcoholic beverages and tobacco Health Recreation and culture Other www.esri.ie @ESRIDublin #ESRIevents #ESRIpublications @ESRIDublin #ESRIevents #ESRIpublications www.esri.ie 8 12 March 2025
Labour market reaching capacity NOMINAL AND REAL WAGE GROWTH 10.0% Labour market is operating at full capacity, with limited potential for further growth 8.0% 6.0% Unemployment is standing at to 4 % in March, April, and May 2024 4.0% The number of job vacancies have further decreased in Q1 2024, following a continuous decrease since the peak in Q2 2022. 2.0% Employment increased by 1.9 per cent in Q1 2024, which is the lowest increase observed within the last three years 0.0% -2.0% Real earnings experience growth for the first time in two years in Q1 2024 -4.0% -6.0% 2010201120122013201420152016201720182019202020212022202320242025 Nominal Inflation (CPI) Real www.esri.ie @ESRIDublin #ESRIevents #ESRIpublications @ESRIDublin #ESRIevents #ESRIpublications www.esri.ie 9 12 March 2025
CLIMBING TAX REVENUES CONTINUE TO BE DRIVEN BY MAIN HEADINGS COMPOSITION OF TAX RECEIPTS 2018-2023 ( ) 100,000,000 Government revenues continued to grow strongly in 2023 mainly due to increases in income tax, corporation tax and VAT 90,000,000 80,000,000 Despite a gradual decrease in growth rates, 2023 represents the peak in absolute terms for tax headings such as income tax, corporation tax receipts, capital acquisitions tax and VAT 70,000,000 60,000,000 Corporation tax receipts, making up more than 25.9 per cent of overall revenue in 2023 50,000,000 40,000,000 Headline General Governmental Balance registered a significant surplus in 2023 mainly due to the significant increase in exchequer taxation receipts 30,000,000 20,000,000 Exchequer receipts in 2024 are remaining strong and are up 6.2 per cent for the year to date 10,000,000 0 2018 2019 2020 2021 2022 2023 Other Excise Duty Income Tax Corporation Tax Valued Added Tax www.esri.ie @ESRIDublin #ESRIevents #ESRIpublications @ESRIDublin #ESRIevents #ESRIpublications www.esri.ie 10 12 March 2025
PUBLIC FINANCES OUTLOOK Public Finances GGB ( bn) GGB (% of GDP) 2023 8.3 1.7 2024 8.5 1.6 2025 9.7 1.7 Debt to output (%) 120.0 100.0 80.0 In recent years, the Irish debt-to-GDP/GNI* ratio has consistently decreased, with projections suggesting this trend will continue in the foreseeable future 60.0 General Governmental Surplus is anticipated to increase over the next years due to expected growth of revenue from taxes and social contribution 40.0 20.0 Expenditure levels are expected to grow at an increasing pace 0.0 2020 2021 2022 2023 2024 2025 GDP GNI* www.esri.ie @ESRIDublin #ESRIevents #ESRIpublications @ESRIDublin #ESRIevents #ESRIpublications www.esri.ie 11 12 March 2025
Risks: Underinvestment in the economy www.esri.ie @ESRIDublin #ESRIevents #ESRIpublications @ESRIDublin #ESRIevents #ESRIpublications www.esri.ie 12 12 March 2025
Importance of investment in the economy Review of the National Development Plan (Barret and Curtis (2024)) Examines the challenges in Meeting the investment targets outlined in the most recent NDP (2018). A key question is the investment share in the economy? Given the significant role played by multi-nationals in the Irish economy, Both estimates of overall output levels and headline investment levels are subject to considerable distortions. Consequently, this makes it acutely difficult to generate A representative estimate of the investment share in an Irish context. www.esri.ie @ESRIDublin #ESRIevents #ESRIpublications @ESRIDublin #ESRIevents #ESRIpublications www.esri.ie 13 12 March 2025
Measurement issues: Estimates of investment 20.0 Availing of Fitzgerald (2023), we use net national product at market prices as an indicator of overall domestic economic activity 15.0 10.0 Combine this with modified gross fixed capital formation as published by the Central Statistics Office 5.0 0.0 Modified investment excludes certain items: 1996 1999 2002 2005 2008 2011 2014 2017 2020 -5.0 Aeroplanes purchased by leasing companies in Ireland but then operated in other countries. -10.0 -15.0 Intellectual property (IP) purchases which typically only relate to foreign-owned corporations and generate profits that flow out of the economy. -20.0 -25.0 -30.0 Not perfect, however, it is the most accurate estimate of investment in the Irish economy. -35.0 Investment Output www.esri.ie @ESRIDublin #ESRIevents #ESRIpublications @ESRIDublin #ESRIevents #ESRIpublications www.esri.ie 14 12 March 2025
Investment share: Headline and underlying 60.0 50.0 40.0 30.0 20.0 10.0 0.0 2005 2006 2007 2008 2009 2010 2011 2012 2013 2014 2015 2016 2017 2018 2019 2020 2021 2022 Underlying Headline www.esri.ie @ESRIDublin #ESRIevents #ESRIpublications @ESRIDublin #ESRIevents #ESRIpublications www.esri.ie 15 12 March 2025
One example of a lack of investment: Housing supply 40000 35000 30000 25000 20000 15000 10000 5000 0 2011 2012 2013 2014 2015 2016 2017 2018 2019 2020 2021 2022 2023 Housing supply Structural Demand www.esri.ie @ESRIDublin #ESRIevents #ESRIpublications @ESRIDublin #ESRIevents #ESRIpublications www.esri.ie 16 12 March 2025
Risks: Credit conditions and house prices? www.esri.ie @ESRIDublin #ESRIevents #ESRIpublications @ESRIDublin #ESRIevents #ESRIpublications www.esri.ie 17 12 March 2025
House prices increases post 2013 Change in house price (%) Recently, we ve seen an increase in house price inflation particularly after Covid-19 20.0 Prices have been increasing since 2013/2014 15.0 Mainly over this period this has been due to Changes in macroeconomic variables 10.0 Fundamentalvariables such as Interest rates, 5.0 Demographics, Income levels and Lack of supply 0.0 2014Q1 2016Q1 2018Q1 2020Q1 2022Q1 2024Q1 Recently though (Egan, McQuinn and O Toole (2024)) note changing credit conditions -5.0 www.esri.ie @ESRIDublin #ESRIevents #ESRIpublications @ESRIDublin #ESRIevents #ESRIpublications www.esri.ie 18 12 March 2025
House prices and credit conditions Average loan to income (multiple) Build-up of the credit bubble just prior to the great financial crisis (GFC) 4.8 4.6 Saw changing credit conditions impact house price movements by themselves 4.4 In particular changes in the loan to income ratio 4.2 4 Macroprudential measures introduced in 2016 set specific limits for the LTI and LTVs 3.8 However, LTI measures were relaxed somewhat in 2022 with the LTI limit going from 3.5 to 4 for first time buyers 3.6 3.4 We find evidence this maybe a factor in influencing recent price movements 3.2 3 2.8 2003Q1 2006Q1 2009Q1 2012Q1 2015Q1 2018Q1 2021Q1 www.esri.ie @ESRIDublin #ESRIevents #ESRIpublications @ESRIDublin #ESRIevents #ESRIpublications www.esri.ie 19 12 March 2025
Scale of the issue? Number of mortgage loans 50000 Not really a systemic risk yet as volume of new loans still quite large. 40000 However, a certain cohort of buyers are now highly leveraged and In the presence of a significant income/affordability shock 30000 Could be quite vulnerable Decision to change macroprudential measures somewhat questionable particularly given the large build-up in savings in the economy post Covid 20000 10000 Fitzgerald, Kenny and Cermeno (2021) highlight households can direct unprecedented savings into real estate 0 2007 2010 2013 2016 2019 2003 2004 2005 2006 2008 2009 2011 2012 2014 2015 2017 2018 2020 2021 2022 2023 www.esri.ie @ESRIDublin #ESRIevents #ESRIpublications @ESRIDublin #ESRIevents #ESRIpublications www.esri.ie 20 12 March 2025
Housing market conditions Household savings ratio (%) 25 23 Decision to change macroprudential measures somewhat questionable? 21 Particularly, given the large build-up in savings in the economy post Covid 19 17 Fitzgerald, Kenny and Cermeno (2021) in examining savings across Ireland, Sweden, the US and UK 15 Highlight households can direct unprecedented savings into real estate 13 11 9 7 5 2013 2015 2017 2019 2021 2023 www.esri.ie @ESRIDublin #ESRIevents #ESRIpublications @ESRIDublin #ESRIevents #ESRIpublications www.esri.ie 21 12 March 2025
Assessment Headline GDP is underestimating domestic economic performance o Headline GDP is underestimating performance of Irish economy due to the decline in exports in 2023, mainly in foreign dominated sectors o The conflict in the Middle East is causing global freight prices to surge which could lead to higher costs for finished and intermediate goods o Decreasing inflation should result in greater rates of investment and consumption globally Irish economy will show moderate growth rates in 2024 o Consumption and investment are expected to grow this year, after investment significantly declined in 2023 o Residential dwelling investment increased while non-dwellings construction dropped o Labour market is operating close to capacity as employment rates continue staying high while unemployment is being low o Inflation is expected to decline throughout 2024 with a return to growth in real incomes o Public finances continue to be in a strong position, with strong growth in income tax and VAT, and levels of corporation tax remaining high o Critical challenge in managing the Irish economy in the period ahead will be dealing with the well documented infrastructure bottlenecks www.esri.ie @ESRIDublin #ESRIevents #ESRIpublications @ESRIDublin #ESRIevents #ESRIpublications www.esri.ie 22 12 March 2025
Thank you www.esri.ie @ESRIDublin #ESRIevents #ESRIpublications @ESRIDublin #ESRIevents #ESRIpublications www.esri.ie 23 12 March 2025
