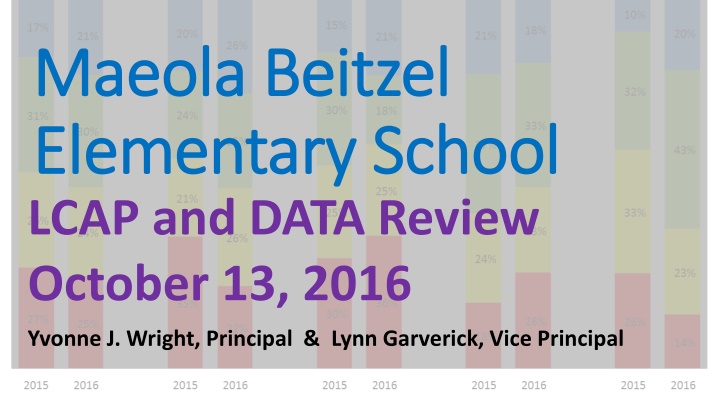
Maeola Beitzel Elementary School LCAP and Data Review
The Local Control Accountability Plan (LCAP) is a vital component of the Local Control Funding Formula, outlining how schools aim to achieve annual goals for students across various priorities. This includes improving student achievement, engagement, school climate, and parent involvement, as well as ensuring access to essential services. The LCAP also encompasses strategic goals focused on high-quality instruction, assessment-guided learning, inclusive environments, and community engagement.
Download Presentation

Please find below an Image/Link to download the presentation.
The content on the website is provided AS IS for your information and personal use only. It may not be sold, licensed, or shared on other websites without obtaining consent from the author.If you encounter any issues during the download, it is possible that the publisher has removed the file from their server.
You are allowed to download the files provided on this website for personal or commercial use, subject to the condition that they are used lawfully. All files are the property of their respective owners.
The content on the website is provided AS IS for your information and personal use only. It may not be sold, licensed, or shared on other websites without obtaining consent from the author.
E N D
Presentation Transcript
Maeola Beitzel Maeola Beitzel Elementary School Elementary School LCAP and DATA Review October 13, 2016 Yvonne J. Wright, Principal & Lynn Garverick, Vice Principal
What is LCAP? What is LCAP? LCAP is Local Control Accountability Plan The LCAP is a critical part of the Local Control Funding Formula. Each school and district must engage parents, educators, employees and the community to establish these plans. The plan describes how the school intends to meet annual goals for all pupils, with specific activities to address state and local priorities.
8 Priorities of LCAP Student Achievement Student Engagement Other Student Outcomes- (Art, PE, etc.) School Climate Parent Engagement Implementation of Common Core Course Access Basic Services (well maintained facilities)
Four Strategic Goals Strategic Goal 1: All students will receive high quality classroom instruction and curriculum to promote college and career readiness and close the achievement gap. Strategic Goal 2: All students will benefit from instruction guided by assessment results (formative, interim, and summative) and continuous programmatic evaluation. Strategic Goal 3: All students will have an equal opportunity to learn in a culturally responsive, physically and emotionally safe environment. Strategic Goal 4: All students will benefit from programs and services designed to inform and involve family and community partners.
Strategic Goal 1: High Quality Classroom Instruction & Curriculum 2016-17 Expected Annual Measurable Outcomes (EAMOs) Teacher Assignment 1. 98% of teachers are appropriately assigned and fully credentialed/ certified in the subject areas in which they teach. Instructional Materials 2. 100% of students have access to standards-aligned instructional materials. Content Standards Implementation 3. 90% of teachers surveyed report full implementation of state content standards in ELA, Mathematics, English Language Development, Science, History/Social Science, PE, Health, School Library, Career Technical Education, Visual and Performing Arts, and World Language. Access to Courses 4. 100% of students have access to and are enrolled in a broad course of study. CAASPP 5. 56% of students will meet or exceed standards in ELA as measured by CAASPP; reduce disparity among student groups by 10%. 6. 47% of students will meet or exceed standards in mathematics as measured by CAASPP; reduce disparity among student groups by 10% 7. 100% Participation in Science CAASPP pilot.
Teacher Assignment Teacher Assignment Strategic Goal 1: EAMO 1 2013-14 NCLB Core Course Section Compliance 2013/14 - 2015/16 2014-15 2015-16 Goal 2015/16 - 2018/19 100% 98.0% 98% % of Core Courses NCLB Compliant 96% 94% 92% 90% 88% 100.0% 100.0% 100.0% 86% Multiple Subject
Instructional Materials Instructional Materials Strategic Goal 1: EAMO 2 2013-14 Student Access to Materials 2013/14 - 2015/16 2014-15 2015-16 Goal 2015/16 - 2016/17 100% 100% 90% % of Students Having Access to Material 80% 70% 60% 50% 40% 30% 20% 10% 100% 100% 100% 100% 100% 100% 100% 100% 100% 100% 100% 100% 0% ELA/ ELD Math Science History/ Social science
CAASPP CAASPP English Language Arts English Language Arts Strategic Goal 1: EAMO 5 English Language Arts 2014/15 - 2015/16 2014-15 2015-16 Goal 2018-19 Goal 2017-18 100% Goal 2016-17 Goal 2015-16 90% 80% % Standard Met or Exceeded 70% 62.0% 59.0% 56.0% 53.0% 60% 50% 40% 30% 20% 10% 100.0% 100.0% 47.4% 51.3% 49.4% 56.1% 62.1% 68.4% 57.1% 68.3% 69.0% 14.9% 10.9% 13.7% 15.0% 27.0% 31.3% 25.0% 38.3% 45.1% 43.5% 41.7% 36.8% 40.9% 0.0% 0.0% 0% Beitzel African American American Indian Asian Filipino Hispanic Pacific Islander White Two or More Declined EL Foster Youth Homeless SED SWD
2016 CAASPP- English Language Arts Performance Categories by Grade Level 10% 15% 17% 18% 20% 20% 21% 21% 21% 26% 32% 30% 18% 24% 31% 33% 30% 25% 37% 43% 25% 21% 33% 25% 26% 23% 24% 26% 24% 23% 36% 35% 30% 27% 26% 26% 25% 22% 18% 14% 2015 2016 2015 2016 2015 2016 2015 2016 2015 2016 All Grades 3rd Grade 4th Grade 5th Grade 6th Grade 9
2016 CAASPP English Language Arts Claims, Grade 3 10% 19% 19% 21% 22% 22% 30% 33% 40% 66% 43% 56% 53% 43% 67% 50% 39% 35% 27% 25% 25% 24% 17% 14% 2015 2016 2015 2016 2015 2016 2015 2016 Reading Writing Listening Research/Inquiry 10
2016 CAASPP English Language Arts Claims, Grade 4 12% 12% 13% 13% 14% 20% 22% 22% 55% 56% 43% 62% 67% 52% 53% 75% 35% 32% 30% 28% 25% 25% 22% 13% 2015 2016 2015 2016 2015 2016 2015 2016 Reading Writing Listening Research/Inquiry 11
2016 CAASPP English Language Arts Claims, Grade 5 13% 19% 19% 22% 28% 31% 33% 38% 49% 68% 58% 44% 64% 51% 51% 53% 33% 28% 23% 19% 18% 16% 14% 9% 2015 2016 2015 2016 2015 2016 2015 2016 Reading Writing Listening Research/Inquiry 12
2016 CAASPP English Language Arts Claims, Grade 6 9% 11% 16% 19% 20% 23% 33% 49% 52% 68% 51% 48% 62% 73% 54% 39% 37% 30% 29% 23% 18% 14% 12% 11% 2015 2016 2015 2016 2015 2016 2015 2016 Reading Writing Listening Research/Inquiry 13
What Are We Doing at Beitzel to Support Students What Are We Doing at Beitzel to Support Students to Meet or Exceed Grade Level in ELA? to Meet or Exceed Grade Level in ELA? Provide teachers professional development on Common Core State Standards Provide teachers professional development on newly adopted curriculum Provide teachers time to meet and analyze student work/data to guide instruction and plan intervention strategies in weekly meetings. Provide students time and opportunity to work in areas of need Provide small group instruction opportunities Provide extended learning opportunities for students
Strategic Goal 1: EAMO 6 Strategic Goal 1: EAMO 6 Strategic Goal 1: EAMO 6 CAASPP CAASPP Mathematics Mathematics Strategic Goal 1: EAMO 6 Mathematics 2014/15 - 2015/16 2014-15 2015-16 100% Goal 2018-19 Goal 2017-18 90% Goal 2016-17 Goal 2015-16 80% 70% % Standard Met or Exceeded 62.0% 60% 51.0% 50% 47.0% 43.0% 40% 30% 20% 10% 100.0% 100.0% 40.1% 23.0% 53.3% 44.8% 57.9% 27.0% 59.8% 30.6% 22.0% 33.9% 35.1% 43.8% 20.5% 25.0% 51.1% 36.4% 57.1% 54.5% 28.3% 11.7% 20.0% 0.0% 0.0% 9.8% 0% Beitzel African American American Indian Asian Filipino Hispanic Pacific Islander White Two or More Declined EL Foster Youth Homeless SED SWD
2016 CAASPP- Mathematics Performance Categories by Grade Level 10% 14% 16% 16% 17% 18% 19% 19% 22% 24% 23% 23% 21% 24% 23% 25% 21% 29% 32% 26% 37% 35% 40% 36% 37% 32% 27% 27% 41% 30% 30% 27% 26% 24% 24% 24% 23% 23% 21% 16% 2015 2016 2015 2016 2015 2016 2015 2016 2015 2016 All Grades 3rd Grade 4th Grade 5th Grade 6th Grade 16
2016 CAASPP Mathematics Claims, Grade 3 20% 21% 27% 27% 32% 33% 47% 46% 39% 39% 64% 57% 32% 29% 29% 27% 16% 16% 2015 2016 2015 2016 2015 2016 Concepts & Procedures Problem Solving & Modeling/Data Analysis Communicating Reasoning 17
2016 CAASPP Mathematics Claims, Grade 4 15% 18% 21% 23% 23% 24% 46% 34% 36% 53% 47% 46% 42% 41% 37% 32% 31% 31% 2015 2016 2015 2016 2015 2016 Concepts & Procedures Problem Solving & Modeling/Data Analysis Communicating Reasoning 18
2016 CAASPP Mathematics Claims, Grade 5 16% 16% 20% 23% 25% 30% 54% 54% 42% 49% 59% 48% 33% 30% 30% 28% 22% 21% 2015 2016 2015 2016 2015 2016 Concepts & Procedures Problem Solving & Modeling/Data Analysis Communicating Reasoning 19
2016 CAASPP Mathematics Claims, Grade 6 13% 14% 14% 21% 21% 32% 44% 51% 61% 54% 40% 61% 42% 35% 28% 26% 25% 18% 2015 2016 2015 2016 2015 2016 Concepts & Procedures Problem Solving & Modeling/Data Analysis Communicating Reasoning 20
What Are We Doing at Beitzel to Support Students What Are We Doing at Beitzel to Support Students to Meet or Exceed Grade Level Standards in to Meet or Exceed Grade Level Standards in mathematics? mathematics? Provide teachers professional development on Common Core State Standards Provide teachers professional development on curriculum aligned to Common Core State Standards Provide teachers time to meet to analyze student work/data to guide instruction and intervention. Provide students time and opportunity to work in areas of need Provide small group instruction opportunities Provide tutoring for students weekly Provide extended learning opportunities for students
Strategic Goal 1: EAMO 7 CAASPP Science Data to be Collected on New Goal 2016-17 District LCAP Plan Goals 2016-17 100% Participation in Science CAASPP pilot. 2017-18: Establish student performance baseline in Science using 2018 CAASPP scores. 2018-19: 5% increase in students meeting or exceeding standards in Science as measured by CAASPP.
2016 CAASPP-Science, Grade 5 12% 17% 21% 45% 43% 56% 33% 30% 23% 9% 5% 4% 2% 2014 1% 2016 2015 23
Strategic Goal 1: EAMO 11 Progress Toward English Proficiency 2013-14 2014-15 2015-16 Goal 2018-19 Goal 2017-18 Goal 2016-17 Goal 2015-16 CELDT Progress 2013/14 - 2015/16 80% 70% 66.5% 65.0% 63.5% 62.0% 60% % Meeting AMAO 50% 40% 30% 20% 10% 62.0% 66.7% 72.6% 0% AMAO1
Strategic Goal 1: EAMO 12 Reclassification Reclassified English Learners 2013/14 - 2015/16 2013-14 2014-15 2015-16 30.0% Goal 2018-19 Goal 2017-18 Goal 2016-17 25.0% Goal 2015-16 % of Reclassified English Learners 20.0% 15.0% 12.0% 11.0% 10.0% 10.0% 10.0% 5.0% 16.7% 6.9% 9.7% 0.0%
What are we doing to support our English What are we doing to support our English Learners to meet English Language Standards? Learners to meet English Language Standards? Providing teachers professional development in best practices to support English learners. Provide teachers professional development on newly adopted curriculum with English language development Provide teachers time to meet and analyze student work/data to guide instruction and plan intervention strategies in weekly meetings. Provide students time and opportunity to work in areas of need Provide small group instruction opportunities with paraeducator support Provide extended learning opportunities for students
Strategic Goal 2: Assessment, Data Analysis & Action 2016-17 Expected Annual Measurable Outcomes (EAMOs) Data and Program Evaluation 1. 100% of the following programs are evaluated: EL, Wellness, Attendance Improvement Initiative, Family and Community Engagement, Instructional Coach Model, Tobacco Use Prevention Education, Improve Your Tomorrow, Security and Safety, and On Grade Level Reading (OGLR). Assessment System 2. 50% of the district s student assessment system is implemented. Student Information System 3. 100% of new student information system transition activities are completed.
Strategic Goal 3: Wellness 2016-17 Expected Annual Measurable Outcomes (EAMOs) Attendance 1. Increase attendance rate to 96.3%. Chronic Absenteeism 2. Decrease chronic absenteeism to 10.3%. Middle School Dropout 3. Decrease middle school dropout rate to 0.18%. High School Dropout 4. Decrease high school cohort dropout rate to 4.3%. Cohort Graduation 5. 90.5% of students will graduate high school on time. Suspension 6. Decrease overall suspension rate to 8.0%, and reduce disparity among student groups by 10%. Expulsion 7. Decrease overall expulsion rate to 0.03%, and reduce disparity among student groups by 10%. School Connectedness 8. 5% improvement in student connectedness as measured by CHKS.
Strategic Goal 3: EAMO 1 Attendance Goal 2018-19: 96.5% Goal 2017-18: 96.4% Goal 2016-17: 96.3% Goal 2015-16: 96.2% 2013-14 Attendance Rate 2013/14 - 2015/16 2014-15 2015-16 100% 98% 96% 94% Attendance Rate 92% 90% 88% 86% 100.0% 100.0% 96.4% 94.6% 92.9% 97.0% 97.1% 96.4% 95.4% 95.3% 95.4% 95.8% 95.7% 96.0% 96.3% 93.3% 91.8% 89.2% 96.0% 95.2% 94.7% 95.7% 96.1% 95.4% 95.0% 93.7% 97.6% 97.0% 97.1% 96.5% 94.9% 94.5% 94.9% 96.7% 96.0% 94.2% 97.1% 96.4% 90.9% 87.0% 93.2% 96.3% 95.5% 94.0% 84% Beitzel African American American Indian Asian Filipino Hispanic Pacific Islander White Two or More Declined EL Foster Homeless SED SWD
Strategic Goal 3: EAMO 2 Absence Goal 2015-16: 10.5% Goal 2016-17: 10.3% Goal 2017-18: 10.1% Goal 2018-19: 9.9% Chronically Absent Students 2013/14 - 2015/16 2013-14 2014-15 100% 2015-16 90% 80% 70% % Chronically Absent 60% 50% 40% 30% 20% 10% 100.0% 11.4% 17.8% 22.0% 11.0% 28.6% 20.0% 11.1% 10.9% 13.8% 12.4% 16.7% 14.3% 30.0% 13.3% 19.6% 33.3% 16.7% 25.0% 75.0% 20.0% 12.2% 19.1% 22.1% 17.0% 9.0% 9.3% 5.3% 4.7% 6.6% 1.8% 5.4% 7.7% 5.6% 9.8% 8.1% 9.0% 0.0% 0.0% 5.3% 9.2% 9.3% 9.7% 9.3% 0% Beitzel African American American Indian Asian Filipino Hispanic Pacific Islander White Two or More Declined EL Foster Homeless SED SWD
What Are We Doing at Beitzel to Support Parents What Are We Doing at Beitzel to Support Parents and Students in meeting attendance goals? and Students in meeting attendance goals? Provide daily phone calls for late/absent students Give students/parents reminders of attendance policy Hold conferences with students and parents about attendance Home visits regarding attendance Give students incentives for positive attendance Recognition for positive attendance
Strategic Goal 3: EAMO 6 Suspension Suspension Rates 2013/14 - 2015/16 2013-14 65 2014-15 2015-16 60 55 50 45 Suspension Rate 40 Goal 2015-16: 9.3 Goal 2016-17: 8.0 Goal 2017-18: 7.8 Goal 2018-19: 7.6 35 30 25 20 15 10 5 1.8 1.3 1.6 1.6 2.8 2.5 1.7 3.2 1.0 5.3 6.0 1.2 5.3 3.7 0.9 1.2 0.7 4.7 1.4 1.0 1.3 1.9 2.0 7.1 0.7 0.4 0 Beitzel African American American Indian Asian Filipino Hispanic Pacific Islander White Two or More Declined EL Foster Homeless SED SWD
Strategic Goal 3: EAMO 7 Expulsion Expulsion Rates 2013/14 - 2015/16 2013-14 2014-15 0.4 2015-16 0.35 Goal 2015-16: 0.04 Goal 2016-17: 0.03 Goal 2017-18: 0.02 Goal 2018-19: 0.01 0.3 0.25 Expulsion Rate 0.2 0.15 0.1 0.05 0.00 0.00 0.00 0.00 0.00 0.00 0.00 0.00 0.00 0.00 0.00 0.00 0.00 0.00 0.00 0.00 0.00 0.00 0.00 0.00 0.00 0.00 0.00 0.00 0.00 0.00 0 Beitzel African American American Indian Asian Filipino Hispanic Pacific Islander White Two or More Declined EL Foster Homeless SED SWD
What Are We Doing at What Are We Doing at Beitzel Parents and Students? Parents and Students? Beitzel to Support to Support Implementation of PBIS (Positive Behavior Intervention and Supports) Catch Students doing something Good Award Weekly Character Announcements PBIS Assemblies Monthly with a Character Focus Anti Bully/Bully Prevention Messaging Community Responsibility Message
Strategic Goal 3: EAMO 8 School Connectedness School Connectedness 2015-16 100% 90% 80% 70% Student Connectedness Score 60% 50% 40% 30% 20% 10% 71.8% 0% Beitzel Note: Elementary student ethnicity and other demographics not available.
Strategic Goal 3: EAMO 9 School Climate School Climate 2015-16 100% 90% 80% 70% 60% 50% Safety Score 40% 30% 20% 10% 75.8% 86.5% 73.8% 0% Beitzel All Parents All Staff Student Survey Parent Survey Staff Survey Note: Elementary student ethnicity and other demographics not available.
Strategic Goal 3: EAMO 10 Facilities Overall Facility Rating 2015-16 Goal 2015/16-2016/17 100% 100% 90% 80% % of Facilities in Good Repair 70% 60% 50% 40% 30% 20% 10% 100% 100% 100% 100% 100% 100% 100% 100% 0% Systems Interior Cleanliness Electrical Restrooms/ Fountains Safety Structural External
Strategic Goal 4: Parent, Family and Community Relationships 2015-16 Expected Annual Measurable Outcomes (EAMOs) Family and Community Engagement 1. 85% of parents will indicate effective provision of opportunities for parent input in making decisions for schools or the district. 2. 85% of parents will indicate effective provision of opportunities for parent involvement or parent education, particularly for unduplicated pupils and individuals with exceptional needs.
Strategic Goal 4: EAMOs 1 & 2 Family and Community Engagement Family Involvement 2015-16 2015-16 Goal 2018-19 Goal 2017-18 100% Goal 2016-17 90% 89.0% 87.0% 85.0% 89.0% 87.0% 85.0% 80% 70% Parent Survey Score 60% 50% 40% 30% 20% 10% 100.0% 100.0% 100.0% 100.0% 78.0% 76.9% 55.6% 86.2% 84.6% 80.5% 74.8% 75.0% 73.0% 79.3% 85.7% 83.0% 96.8% 85.2% 0% Beitzel African American American Indian Asian Filipino Hispanic Pacific Islander White Two or More Beitzel African American American Indian Asian Filipino Hispanic Pacific White Two or More Islander Opportunities for Parent Input Opportunities for Parent Involvement/Parent Education
How do We Engage Families in D Decision M Making, P Parent E Education, and S School F Functions? Participation on School Site Council- DM, SF Participation on ELAC-DM Coffee with Principal-DM PTO-DM, SF Parent Universities- PE Picnic With Parents -SF Volunteer -SF Watch D.O.G.S.-SF M.O.M.S.-SF LCAP DATA NIGHT-DM
Opportunity for Input in our Plan (LCAP) Opportunity for Input in our Plan (LCAP) Survey Monkey https://www.surveymonkey.com/r/TC7BXTX
