Maintaining Healthy Soils and Balancing Nutrition for Sustainable Agriculture
Explore the key aspects of maintaining healthy soils and balancing nutrition for optimal crop production. Learn about the impact of biomass, root respiration, soil physical properties, and nutrient deficiencies on plant health and growth. Gain insights into the effects of compacted soils, nitrogen deficiency symptoms, and the role of essential nutrients like phosphorus, potassium, calcium, and magnesium in plant development. Discover how to enhance soil quality and nutrient balance for sustainable agriculture practices.

Download Presentation

Please find below an Image/Link to download the presentation.
The content on the website is provided AS IS for your information and personal use only. It may not be sold, licensed, or shared on other websites without obtaining consent from the author. If you encounter any issues during the download, it is possible that the publisher has removed the file from their server.
You are allowed to download the files provided on this website for personal or commercial use, subject to the condition that they are used lawfully. All files are the property of their respective owners.
The content on the website is provided AS IS for your information and personal use only. It may not be sold, licensed, or shared on other websites without obtaining consent from the author.
E N D
Presentation Transcript
Maintaining Healthy Soils & Balancing Nutrition By: Steve Trotter, Agroplasma Inc.
Healthy Soils: Biomass, Physics & Chemistry Biomass: Roots Biology Organic Matter A. Root respiration: Consumes O2 and liberates CO2 B. Biology: 1. Respiration leads to release of CO2and utilization of 02 2. Greater CO2production from Rhizosphere 3. Greater 02depletion rate 4. Influences crop production by forming carbonic acid which causes solubilization of insoluble, inorganic nutrients not available. (drops pH in soil) C. Organic Matter A. 3% to 6% B. Light fraction, chemically stable & physically protected C. Optimum source: root activities
Soil Physical Properties 1. Sand, silt & clay values may be described as: Sand 50% Silt 25% Clay 25% 2. Measure capillary & non capillary porosity 3. Measure infiltration, percolation & drainage 4. Measure plant available water a. Smaller pores hold water against gravity due to capillary forces b. Larger pores hold 02, provide rooting space & increase drainage 5. Pore Size in determining by sand size, silt & clay content, and the amount and type of organic matter 6. Determine the wilting point on a tension table, infiltration rate is not the same as water retention 7. Always relate to C.E.C. values
Soil Physical Properties (Contd) 8. Compacted soils reduce larger pores, roots cannot decrease in diameter to enter pores smaller than diameter of root tip. (Wiersum, 1957) 9. Root elongation rates fall 10. Plants growing in compacted soils are more susceptible to drought 11. Inhibition of root extension other than compacted soils: a. Dry Soils 1) Mechanical impedance 2) Decrease soil water potential b. Wet Soils 1) Decrease in aeration 2) Phytotoxian increase 12. Soil aeration and the accumulation of phytotoxins there become the dominant stress factors in root growth
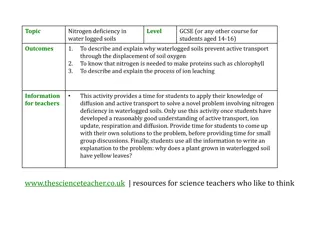
Nutrient Nitrogen (N) Deficiency Symptoms of the Plant Loss of green color (appears first on older leaves) Stunted growth Lack of vigor Decreased recuperative potential Susceptible to diseases Reduced shoot growth Dark green color Reduced root growth Dieback at leaf tip Scorching or firing of margins High N fertilization Toxicity in the Plant and Environment Excessive growth Prone to insect attack Poor recuperative potential Reduced root, rhizome Reduced heat and drought tolerance Toxicity is uncommon Phosphorus (P) Potassium (K) Cause salinity High K can suppress Mg, Ca or Mn uptake Excess K can cause fertilizer burn High soil Ca may cause Mg, K, Mn, or Fe deficiencies Calcium (Ca) High sodium levels Leaf tips & margins may wither & die Roots may be stunted Reduction in cell wall formation Influences disease susceptibility Loss of green color Color goes from pale green to cherry red Leaf margins blotchy red Leaf veins remain green and some light yellow striping Magnesium (Mg) High Mg can induce K, Mn, or Ca deficiencies
Nutrient Sulfur (S) Deficiency Symptoms of the Plant Reduced shoot growth rate Yellowing of new leaves Poor rooting Immobile in young leaves Thin, spindly growth Older leaves exhibit chlorosis Toxicity in the Plant and Environment High foliar rates lead to foliar burn Iron (Fe) High Fe can cause Mn deficiency Acidic poorly drained soils can produce toxic levels of Fe Poorly drained anaerobic soil reacts with S to cause black layer Acid soils Anaerobic soils High Mn can cause Fe, Mg, or Ca deficiencies Plants may tolerate Mn toxicity at high temperatures Manganese (Mn) Decrease in photosynthesis Decrease in shoot/root growth Leaf veins remain green and some light yellow striping Chlorosis on younger leaves Interveinal yellowing Leaf tips can turn white Chlorotic leaves Stunted leaves Leaf margins may roll or appear crinkled Appear on youngest leaves Yellowing leaf margins Stunted growth with leaves Zinc (Zn) Cause chlorosis by inducing Fe or Mg deficiencies Copper (Cu) Sewage, industrial sludges, mine spoils, pig/poultry manure
Nutrient Boron (B) Deficiency Symptoms of the Plant Slowed growth Younger leaves have tip burn chlorosis Interveinal chlorosis Roots may be stunted Plants are stunted Mobile in plant Similar to N deficiency Toxicity in the Plant and Environment More likely toxicity than deficiency Irrigation water Compost amendments Molybdenum (Mb) High pH soils Wet soils Chlorine (Cl) Chlorosis of new leaves Wilting Leaf curling Stunted shoot & root growth Can be directly toxic to leaf tissues and roots because it s a salt Reduces water availability by enhancing total salinity Nickel (Ni) Chlorosis as interveinal yellowing & eventually necrosis Failure of leaf tip to unfold Industrial or sewage sludge
Typical Influences or Impacts Calcium: Magnesium: Potassium: Sodium: Phosphorus: Iron: Sulfur: Phosphorus, Zinc, Magnesium & Manganese Calcium, Phosphorus Manganese, Sodium, Iron Potassium Zinc, Calcium Magnesium Copper, Potassium, Phosphorus Nitrogen, Iron (odor creator in plants)
Soil Tests Saturated Paste Report Soil Report Job Name: 7/10/2017 Date: 7/10/2017 Job Name Date Company: Agroplasma Tim Dagg Submitted By: Agroplasma Tim Dagg Company Submitted By Evaluation Evaluation Non-Eval Non-Eval Evaluation Evaluation Non-Eval Non-Eval Sample Location Sample Location Area A Area B Area C Area D Area A Area B Area C Area D Sample ID Sample ID 108259 108260 108261 108262 19 20 21 22 Lab Number Lab Number DI DI DI DI 6 6 6 6 Sample Depth in inches Water Used Total Exchange Capacity (M. E.) 4.79 5.40 4.55 4.27 7.5 7.3 7.5 7.4 pH 7.5 7.3 7.5 7.4 pH of Soil Sample 127 123 92 90 Soluble Salts ppm 1.49 1.71 1.68 1.41 Organic Matter, Percent 8 6 6 7 Chloride (Cl) ppm 12 14 12 12 p.p.m. SULFUR: 83 81 81 76 Bicarbonate (HCO3) ppm 292 340 299 217 as (P O ) Mehlich III Phosphorous: 2 5 lbs / acre 1.93 1.79 1.03 1.51 SULFUR ppm 1301 1332 1469 1562 1237 1305 1162 1248 Desired Value 1.7 2.44 1.87 1.07 PHOSPHORUS ppm CALCIUM: lbs / acre Value Found 19.41 18.34 15.69 15.25 Deficit ppm CALCIUM 200 226 200 226 200 201 200 178 -22 0.97 0.92 0.78 0.76 Desired Value meq/l MAGNESIUM: lbs / acre Value Found 6.09 5.79 4.20 3.80 ppm Deficit MAGNESIUM 0.51 0.48 0.35 0.32 meq/l 200 199 200 186 -14 200 144 -56 200 127 -73 Desired Value POTASSIUM: lbs / acre Value Found 12.49 11.77 6.72 5.88 ppm -1 Deficit POTASSIUM: 0.32 0.31 0.17 0.15 meq/l 34 44 42 36 lbs / acre SODIUM: 69.57 19.67 72.29 17.43 71.68 18.40 73.00 17.35 4.27 4.92 3.09 4.03 Calcium (60 to 70%) ppm SODIUM 0.19 0.21 0.13 0.18 Magnesium (10 to 20%) meq/l 5.33 4.41 4.06 3.81 Potassium (2 to 5%) 48.82 47.78 54.36 54.17 Calcium 1.56 1.77 2.00 1.81 Sodium (.5 to 3%) 25.51 25.16 24.24 22.52 Magnesium 3.90 4.10 3.90 4.00 Other Bases (Variable) 16.32 15.93 12.09 10.85 Potassium 0.00 0.00 0.00 0.00 Exchangable Hydrogen (10 to 15%) 9.34 11.14 9.31 12.46 Sodium 0.35 49 0.33 47 0.3 48 0.31 40 0.07 5.12 0.09 < 0.02 0.04 1.32 0.09 4.52 0.09 < 0.02 0.03 1.19 0.06 2.36 0.06 < 0.02 0.03 6.15 0.06 1.84 0.03 < 0.02 < 0.02 Boron (p.p.m.) Boron (p.p.m.) Iron (p.p.m.) Iron (p.p.m.) 36 33 33 31 Manganese (p.p.m.) Manganese (p.p.m.) 2.28 2.36 2.36 1.96 Copper (p.p.m.) Copper (p.p.m.) Zinc (p.p.m.) 10.33 12.2 11.35 8.37 Zinc (p.p.m.) 4.8 Aluminum (p.p.m.) 164 162 142 145 Aluminum (p.p.m.) Logan Labs, LLC Logan Labs, LLC
Micro Influences A deficiency of one nutrient will create a stress signal, but may also suffer toxicity of another nutrient that is accumulated under stress May complicate the diagnosis Soluble protein concentration will be drastically reduced by Zn deficiency. (Marschner, 1995) Protein will be unaffected by Cu or Mn deficiency and ?? the Zn involvement in protein synthesis. (Marschner, 1995) Disruption of carbon assimilation. Impairment of photosynthetic transport. (Bowler et al.,1992; Marschner, 1995)
Environmental Stresses (Oxidative Stress) Herbicide exposure Pathogen attack Air pollutants Drought Waterlogging Salinity Heavy Metal Toxicity Mineral nutrient deficiency
Environmental Stresses (Oxidative Stress) -Contd Ethylene production increases Early senescence Delayed senescence Modulate normal growth and development Promoters to growth: Auxin, gibberellin, cytokinin Inhibitors to growth: ethylene, abscisic acid Dormancy: Retain viability while having minimal metabolic activity and no visible growth. (A survival mechanism) Challenge of multiple environmental stresses Conditions are considered suboptimal, which prevents plants from attaining their full genetic potential for growth and reproduction. (Bray et al, 2000)
Stress Influences Heat Stress Causes plants to open their stomata for cooling May increase salt uptake in drought More water is lost in drought Plants must efficiently balance resource allocation between growth and defend against stress Simultaneous biotic and abiotic will present an added degree of complexity (Anderson et al, 2004) Drought stress can cause detrimental effects to plant pathogen resistance. (McElrone et al, 2001
Stress Response to Low Resource Supply Insufficient nutrient supply is perceived as physiological change This nutritional response will exhibit many features that are similar to environmental stress Challenger to nutrient uptake and mobilization Growth limiting factors such as roots in the case of N stress and shoots in the case of C stress. Example of low N may increase CO2concentration inside the leaf. Low N consistently results in an increase in abscisic acid (ABA) (Chapin et al, 1988)
The direct environmental controls and source-sink feedbacks affecting resource acquisition and growth by plants.
Amino Acids for Support in Rhizosphere Found in soils in the free form, or not bound to any other chemical activity or entity. Inorganic N is generally more abundant in soils in certain ecosystems: forest Organic N (free amino acids and protein) in abundant in most soils. (Chapin et al., 1993) Plants and microbes compete for free amino acids in the rhizosphere. (Owens and Jones, 2001) Important if you rely on organic matter for N. (Reeve et al., 2009)
Amino Acids for Support in Rhizosphere Contd Amino acids are important as a source of N, and uptake from soil for long distance transport to developing tissues C to N ratio, biodegradability & placement in the rhizosphere not bulk soil are important in plant & microbe use. When ammonium N is abundant, acquisition of other N sources is repressed or N regulation (Geisseler et al., 2010) Presence of free amino acids in the rhizosphere likely contributes to the richness of the microbial community at the plant root soil interface
Correcting Nutrition & Soil Balance Initiate soil correction programs with nutrient applications Frequency of events Manage organic matter Identify limiting factors such as P & Zn, K & Mg, K & B, Ca & B, Fe & Mn, Ca & S Balance N sources Identify limiting factors for nutrients selected for use. Best examples will be the use of K & Ca in alkaline soil systems
Correcting Nutrition & Soil Balance Contd Do no overlook the nutritional impact water delivers to the soil rhizosphere Foliar spray or any substance present on the leaf surface will penetrate the surface as long as there is a concentration gradient across the leaf surface for diffusion Nutrient sprayed on the leaves will penetrate the surface irrespective of the physiological requirements of the plant Highest absorption rates can be expected at intermediate levels of relative humidity
"When we try to pick out anything by itself, we find it tied to everything else in the Universe. John Muir (1838 1914) There are in fact two things, science and opinion; the former begets knowledge, the latter ignorance. Hippocrates
Thank you for your time 5865 S. Kyrene Road Suite 1 Tempe, AZ 85283 Corporate Office - (480) 361-1300 Mike Gilmore - (209) 241-3786 Doug Elliott - (805) 354-2074 www.agroplasmausa.com


")


")
 -Cont’d")