Managerial Strategies for Global Growth via M&A
In mergers and acquisitions (M&A), companies employ various managerial strategies like financial, operational, and transactional to foster global expansion. Drivers such as globalization and innovation fuel the cross-border M&A trend, offering benefits like business acceleration and accessing capital. However, challenges including legal, cultural, and technology integration aspects must be navigated for successful M&A deals.

Download Presentation

Please find below an Image/Link to download the presentation.
The content on the website is provided AS IS for your information and personal use only. It may not be sold, licensed, or shared on other websites without obtaining consent from the author. If you encounter any issues during the download, it is possible that the publisher has removed the file from their server.
You are allowed to download the files provided on this website for personal or commercial use, subject to the condition that they are used lawfully. All files are the property of their respective owners.
The content on the website is provided AS IS for your information and personal use only. It may not be sold, licensed, or shared on other websites without obtaining consent from the author.
E N D
Presentation Transcript
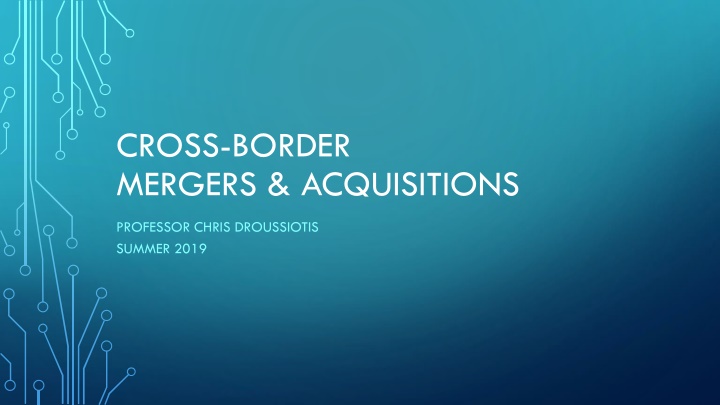
CROSS-BORDER MERGERS & ACQUISITIONS PROFESSOR CHRIS DROUSSIOTIS SUMMER 2019
MANAGERIAL STRATEGIES AND THE NEED TO GROW GLOBALLY VIA ACQUISITIONS MERGERS & ACQUISITION OVERVIEW CROSS-BORDER MERGER & ACQUISITIONS: OPPORTUNITIES AND CHALLENGES AGENDA MERGERS & ACQUISITION PROCESS ANALYTICAL APPROACH TO M&A, VALUATIONS AND STRUCTURES MERGERS & ACQUISITIONS PROCESS (FIRST ROUND & SECOND) ACCRETION ABD DILUTION ANALYSIS
MANAGERIAL STRATEGIES Financial Strategy Raising Equity Raising Debt Operational Strategy Revenue Growth (organic) Expense Management Hiring Talent Marketing the Product Transactional Strategy Merger Acquisitions Joint Ventures Strategic Alliances Greenfield Investment Social Responsibility Governance Shareholders/ Employees / Government / Community 3
DRIVERS OF CROSS BORDER M&A Globalization and openness of financial markets Geographical diversification Deregulation of markets Company efficiency Hedging on Trade and Tariffs Increase production Technology and Innovation boom across cultures
NATURAL PROGRESSION FOR A GROWTH COMPANY Companies started a domestic production 1 Companies started to export to the foreign markets 2 Companies established a subsidiary in overseas market 3 Companies started strategic alliances customer acquisition 4 Companies started a Greenfield project build manufacturing facility 5 Companies started to acquire other companies in foreign markets 6
BENEFITS OF CROSS BOARDER M&A Acceleration of business Accessing capital Synergies Technology Tax planning Mitigation of trade and foreign exchange costs
CHALLENGES OF CROSS BOARDER M&A Legal Accounting Strategic Technology Integration Human Resources Cultural
CHALLENGES OF CROSS BOARDER M&A Legal Issues Acquirer need to understand all the legal provisions of the foreign country After understanding the local laws, the acquirer many find that these provisions are incompatible, resulting to lengthy process and company policy changes Ex-pat and HR laws / Visa issues Labor laws Sarbanes & Oxley Laws on publicly traded companies
CHALLENGES OF CROSS BOARDER M&A Accounting Issues Merging entities have different internal controls Absence of uniformity of internal controls could lead to mismanagement Accounting Standards (International Vs US GAAP) Merger accounting adjustments to the Balance Sheet could result to overvalue or undervalue
CHALLENGES OF CROSS BOARDER M&A Technological Differences Integration challenges due to different technology platforms Strategic Issues Achieving synergies can be challenging including cost savings plant rationalization Labor issues IT integration marketing integration management changes
CHALLENGES OF CROSS BOARDER M&A Cultural Differences Corporate Governance Job Security Regular and external environments Customer Expectations Operating styles due to different backgrounds Country culture and different values
CHALLENGES OF CROSS BOARDER M&A Human Resources Issues Motivation & Morale Layoffs and voluntary leave Employee stress due to uncertainty Career paths of each employee could be ultered Organizational changes
PROCESS OF ACQUIRING THE TARGET COMPANY Stage 2 Stage 3 Stage 1 The Tender offer and Settlement Post Acquisition Management Identification & Valuation
PROCESS OF ACQUIRING THE TARGET COMPANY Well Define Corporate Strategy Public vs Private Company Quantify the Return (ROI) and Risk Valuation Methodologies Accretion vs Dilution Analysis Stage 1 Identification & Valuation
PROCESS OF ACQUIRING THE TARGET COMPANY Well Define Corporate Strategy Public vs Private Company Quantify the Return (ROI) and Risk Valuation Methodologies Stage 2 Identification & Valuation
PROCESS OF ACQUIRING THE TARGET COMPANY Securing the approval of the management and ownership of the target company to government and regular bodies (friendly vs hostile takeover) Settlement compensation payment to the shareholders of target company Cash or Common stock Accretion vs Dilution Analysis Various factors for determining the methods used for settlement availability of cash, sixe of target firm Access to Capital Stage 2 Tender Offer & Settlement (after the Target has been identified)
PROCESS OF ACQUIRING THE TARGET COMPANY This is very important stage because it ill determine is relatively quick order the success or failure of the acquisition The objective is to create shareholder value Problems identified earlier including the failure of meeting synergies, high cost of integration and difficult corporate culture Stage 3 Post-Acquisition Management
MODES OF MERGERS & ACQUISITIONS M&A Amalgamation Acquisition Stock Purchase Merger De-Merger Asset Purchase
U.S. REGULATIONS ON PUBLIC TARGETS Proxy Statements Schedule TO/Schedule 14D-9 Registration Statement/Prospectus (S04. 424B) Schedule 13E-3 8K / 10K / 10Q
U.S. REGULATIONS ON PRIVATE TARGETS Not required to public filing of documents When a public company buys a private company (or a division/subsidiary of a public company) it may require to file certain disclosure documents Issuing shares in excess of 20% LBOs accessing public bonds file with the SEC (S-4)
PRIMARY SEC FILINGS IN M&A TRANSACTIONS SEC Proxy Statements Description Prem 14A /Defm 14A Preliminary/definitive proxy statement relating to an M&A transaction Prem 14C / Defm 14C Preliminary / definitive information statement relating to an M&A transaction Schedule 13E-3 Filed to report going private transactions initiated by certain issuers or their affiliates SEC Tender Offer Description Schedule TO Filed by an acquirer upon commencement of a tender offer Schedule 14D-9 Recommended from the target s board of directors on how shareholders should respond to a tender offer SEC Registration Statement Prospectus Description S-4 Registration statement for securities issued in connection with a business combination with a business combination or exchange offer. May include proxy statement of acquirer and/or public target 424B Prospectus
IDENTIFYING THE CANDIDATE DEFINE THE STRATEGY State the Objective: i.e. Revenue Growth / Trade Barriers / Cost Efficiencies Identify the Business Model & Markets: i.e. Technology / Product Price Range Expectation and accessing capital (Debt/Equity balance) Zero in on few target candidates Begin the preliminary analysis Valuation, Accretion and Return analysis
AK Steel Holding Corp. (AKS) CORPORATE VALUATIONS SCREENING BASIC INFORMATION 9/30/2018 SYMBOL= 11/29/2018 SYMBOL= AKS Financial Statements Date of Reporting: 6 BOOK VALUE MARKET VALUE Last Reported Performance (LTM) Revenues (LTM) Per Share $21.04 $1.49 -$0.08 General Market Information Stock Price Common Shares Outstanding (000's) Market Capitalization (Equity Value) 8 9 10 EBITDA (LTM) 11 Net Income (LTM) 6,640,000 470,000 ($25,200) $ 3.10 315,540 $978,174 Company: AK Steel Holding Co. (EPS) Enteprise Value = $2,960,874 12 13 Book Value of Assets 14 Book Value of Equity 15 Total Debt 16 Total Cash Products: Flat-rolled carbon, stainless, and electrical steels, flat-rolled carbon steel products, including coated, cold-rolled, and hot-rolled carbon steel products; grain-oriented specialty stainless and electrical steels; and carbon and stainless steel tubing products. $4,487,900 $14.22 Dividends/Share $0.00 $97,100 $0.31 Beta= 2.91 $2,030,000 $47,300 $6.43 $0.15 Market Value to Book Value Relationship AKS Equity MV / BV 17 18 Profitability 19 ROE % 20 ROA% 21 Book Value of Equity / Shares 10.07x Tobin's Q Ratio (EV/ Total Assets) 0.66x -25.95% Price / Earnings -117.50x Customers: Automotive manufacturers; customers in the infrastructure and manufacturing markets, including the manufacturers of power transmission and distribution transformers, who produce equipment for the electrical grid. -0.56% Price / Sales 0.45x $ 0.31 Price / EBITDA 6.30x 22 23 Other: AK Steel Holding Corporation was founded in 1993 and is headquartered in West Chester, Ohio. SOURCE: https://finance.yahoo.com/quote/AKS?p=AKS
ANALYTICAL APPROACH TO M&A VALUATION METHODS: Method 1: Method 2: Method 3: Method 4: Method 5: Using the current stock price as a basis of valuation Comparable method using Trading EBITDA Multiples Comparable method using Acquisition EBITDA Multiples Discount Cash Flow Method (DCF) Leveraged Buyout Private Equity Expectation Model (LBO)
METHOD 1: USING THE STOCK PRICE AS THE BASIS OF VALUATION The stock price represents the value of the company. The company issues financial statements every three months and other non-financial information as they come up, so how does the stock price behave like this? It is said that the stock price moves based on technical, fundamental and behavioral reasons and there are plenty of analytical approaches that back each of these three reasons. EV = MVE + D C and MVE = (SP + SO) where EV is Enterprise Value, MVE is the Market Value of the Equity, D is the total Debt Outstanding and C is the Cash and cash equivalents of the company. where MVE is the Market Value of the Equity, SP is the Stock Price and SO is the Shares Outstanding.
METHOD #1 AK Steel Holding Corp. (AKS) CORPORATE VALUATIONS METHOD #1 - Market Value / Using the Stock Price SP SO SP * SO = EQ D C EQ + D - C = EV Calculations Stocks Outstanding ($000) 11/29/2018 Equity Value ($000) 11/29/2018 ENTERPISE VALUE: $2.96 Billion Debt (ST<) ($000) 9/30/2018 Cash ($000) 9/30/2018 Enterprise Value ($000) 11/29/2018 Stock Price 11/29/2018 Company Symbol AKS $ 3.10 315,540 978,174 2,030,000 47,300 2,960,874 AK Steel
METHOD 2 USING COMPARABLE TRADING EBITDA MULTIPLES The most commonly used method by mergers & acquisitions professional Looks at the ratio of the Enterprise Value to Earnings Before Interest, Taxes, Depreciation and Amortization (EV /EBITDA) for each of the pier companies and applies the average to measure the company s value. The average multiple provides a benchmark which the analyst can establish as the basis for valuating publicly traded companies The basic idea is that as the company increases its earnings based on either favorable economic conditions or management decisions from year to year, then the value should also follow at a relatively consistent way. In general, industries with higher growth characteristics enjoy higher multiples of earnings. Similar companies that compete with the company that is being valued given the similar business and financial characteristics.
AK Steel Holding Corp. (AKS) CORPORATE VALUATIONS METHOD #2 METHOD #4 -Average EBITDA Industry Trading Multiples SP SO SP * SO = EQ D C EQ + D - C = EV E EV / E Stocks Outstanding ($000) Debt (ST<) ($000) Enterpris e Value ($000) Equity Value ($000) Cash ($000) EBITDA ($mm) EBITDA Multiple Stock Price Beta Company Symbol ENTERPISE VALUE: $2.49 Billion United Steel X $ 22.93 177,270 4,064,801 2,500,000 1,340,000 1,360,000 5,224,801 3.84x 4.04x Steel Dynamics STLD $ 35.12 229,550 8,061,796 2,370,000 999,320 1,860,000 9,432,476 5.07x 1.50x Reliance Steel Industries RS $ 79.99 70,430 5,633,696 2,070,000 112,100 1,180,000 7,591,596 6.43x 1.08x Schtzer Steel Industries SCHN $ 26.66 25,690 684,895 107,380 4,700 195,020 787,575 4.04x 0.78x Olympic Steel ZEUS $ 18.19 11,010 200,272 304,480 4,270 70,450 500,482 7.10x 2.52x AK Steel Holding Corp. (AKS) AKS $ 3.10 315,540 978,174 2,030,000 47,300 470,000 2,960,874 6.30x 2.91x EBITDA * Average Multiple Average 470,000 5.30x 5.30x 2.14x Enteprise Value 2,489,971
METHOD 3 USING COMPARABLE ACQUISITION EBITDA MULTIPLES This method establishes a similar bench mark to what the companies in the same industry are being bought based on multiples of their EBITDA. Corporate values using this method are determined based on other companies in the same business that are recently sold to either strategic investors or private equity firms. The mergers & acquisition professional search for other companies in the same business that were sold to either strategic investors or private equity firms and establishes a bench mark based on average multiples over time. That average acquisition multiple of the purchase price to EBITDA is then used as a measurement to value the company in question.
METHOD #3 AK Steel Holding Corp. (AKS) CORPORATE VALUATIONS METHOD #5 - Using Averge EBITDA Transaction Multiples (M&A Comparable Method) AP SO AP * SO = EQ ND EQ + ND = EV E EV / E Calculations Acquisiti on Price /Share Equity Value ($000) Total Net Debt ($ 000) ENTERPISE VALUE: $2.94 Billion Shares Outstanding Enterprise Value (EV) EBITDA ($ 000) EBITDA Multiple Target Acquirer ZS Steel Archimedes PE $ 47.50 24,000,000 1,140,000 $ 1,500,000 $ 2,640,000 $ $ 350,000 7.54x Celerity Steel Manufacturing AZM Steel & Aliminum $ 34.00 123,000,000 4,182,000 $ 2,500,000 $ 6,682,000 $ 1,100,000 $ 6.07x $ 45.00 13,500,000 $ 607,500 $ 450,000 1,057,500 $ $ 190,000 5.57x Yes Steel & Aluminum Co. Kingtom Steel $ 22.00 234,000,000 5,148,000 $ 1,400,000 $ 6,548,000 $ 1,230,000 $ 5.32x HI Steel Manufacturing Inc. Excel Steel $ 12.00 85,000,000 1,020,000 $ 1,200,000 $ 2,220,000 $ $ 320,000 6.94x Precision Steel MW Inc. $ 8.00 45,000,000 $ 360,000 $ 240,000 $ 600,000 $ 98,000 6.12x Ross West Steel Greenstone Capital Average 6.26x 2,942,726 Enteprise Value 470,000 6.26x
METHOD 4 USING DISCOUNT CASH FLOW METHOD This method is the most fundamental method that is used to value many types of companies, especially companies that are tough to find any trading and acquisition multiple comparables. This method called the DCF method that is broadly used by many investors, advisors, banks and academics is premised on the principal that the value of a company can be derived by the present value of its projected free cash flow (FCF). We will learn later that this FCF is derived from various assumptions, starting from Revenue and subtracting operating and capital costs. To value the company using the DCF method the analyst needs to derive the following four items: Setting up a stream of cash flows Identifying an exit year. Calculating the value at exit year (Terminal Value) Using the appropriate discount rate to value the present value of the firm.
AK Steel Holding Corp. (AKS) CORPORATE VALUATIONS METHOD #6 - Discount Cash Flow Valuation Analysis year = 1 2 3 4 5 6 Historical Assumptions Projected Assumptions Input Actual 9/30/2018 6,640,000 EXIT YEAR 12/31/2022 7,962,617 Discout Cash Flow Valuation Analysis METHOD #4 12/31/2018 6,905,600 12/31/2019 7,181,824 12/31/2020 7,433,188 12/31/2021 7,693,349 12/31/2023 8,241,308 Revenues Revenue Growth Cost of Revenues (CoGS) Operating Expenses (Excl. Non-rec.) EBIT Less Taxes (tax rate x of EBIT) Plus Depreciation Less Working Capital Less Capex Cash Flow 4.0% 4.0% 3.5% 3.5% 3.5% 3.5% 87.7% 9.1% 86.0% 8.0% (5,820,800) (602,300) 216,900 253,100 (5,938,816) (552,448) 414,336 (149,161) 276,224 (172,640) 368,759 (6,176,369) (574,546) 430,909 (155,127) 287,273 (179,546) 383,509 (6,392,542) (594,655) 445,991 (160,557) 297,328 (185,830) 396,932 (6,616,280) (615,468) 461,601 (166,176) 307,734 (192,334) 410,825 (6,847,850) (637,009) 477,757 (171,993) 318,505 (199,065) 425,204 (7,087,525) (659,305) 494,478 (178,012) 329,652 (206,033) 440,086 36.0% 4.0% 0.0% 2.5% - 3.8% 0.0% 2.5% - - - - - - ENTERPISE VALUE: $3.6 Billion (164,900) 305,100 470,000 2,030,000 690,560 1,928,500 718,182 1,827,000 743,319 1,725,500 769,335 1,624,000 796,262 1,522,500 824,131 1,421,000 EBITDA Debt (assuming 5% reduction of intial principal per year) Terminal Value EBITDA Multiple Method Perpetuity Method Average Less Debt Outstanding (at Exit) Plus Cash (at Exit) Equity Value at Terminal Assumptions Growth 5.30x 13.56% (EBITDA x EBITDA Multiple) 3.00% Next Year's Cash Flow / (Discount Rate - Growth) 4,218,443 4,168,004 4,193,224 (1,522,500) 2,670,724 - 368,759 383,509 396,932 410,825 3,095,927 Equity Cash Flows 32% PV (for $1) 0.7584376 0.5752276 0.4362743 0.3308868 0.2509570 PV (1) = PV (2) = PV (3) = PV (4) = PV (5) = PV= $279,681 $220,605 $173,171 $135,937 $776,945 $1,586,338 1 2 3 4 5 Cost of Equity Calc Risk Free Rate (5 year) Premium based on MC = Company Beta = Expected Equity Return = Interest LTM ($ 000s) 150,500 7.41% Rate 2.75% 10.00% 2.91x 31.9% Enterprise Value = PV of Equity = + PV of Debt = + PV of Cash = PV of Equity + PV of Debt $1,586,338 2,030,000 (47,300) 3,569,038 Enterprise Value WACC Calc: Debt MV Equity % Cap 67.5% 32.5% 100.0% AT RoR 4.745% 31.850% WACC 3.202% 10.357% 13.559% 2,030,000 978,174
METHOD 5 USING LEVERAGED BUYOUT (LBO) OR NON-RECOURSE METHOD This method is very similar to method 4 (DCF method) which is based on future free cash flows except the projected debt, WACC and expected return. While the DCF analysis is used for determining today s value of the company based on future cash flows, the value of the company using this LBO method is determined based on investor expectation which is return determines the acquisition price of the firm. The equity investment amount is determined after assuming that most of the financing will be via debt. This method is unique because it uses the capital markets to engineer the financing of the buyout, so the equity return expectation is met via the use of leverage. This method starts step by step starting first with the maximum debt the private equity can raise based on the target s cash flow..
AK Steel Holding Corp. (AKS) CORPORATE VALUATIONS METHOD #7 - Leveraged Buyout (LBO) Analysis METHOD #5 Shares Outstanding (millions) 315,540 Total Amount ($ 000's) 978,174 2,030,000 105,286 3,113,460 Current Stock Price $ Purchase Stock Price $ % Total Uses 31.42% 65.20% 3.38% 100.00% EBITDA Multiple Transactions Uses Premium 0% 3.10 3.10 2.08x 4.32x 0.22x 6.62x Purchase of 100% Shares Refinance Short-Term & Long Term Debt Transaction Fees & Expenses Total Cost of Transaction (Uses) 3.50% EBITDA Multiple (Capacity) 2.00x 1.00x 3.00x 3.62x 6.62x Interest Rate / Expected Return 5.0% 8.0% After Tax Interest Rate Adjustments 3.20% 5.12% Total Amount ($ 000's) 940,000 470,000 1,410,000 1,703,460 3,113,460 WACC Calc 0.966% 0.773% Transactions Sources % Capital 30.19% 15.10% 45.29% 54.71% 100.00% Setting up the financial structure Bank Loan Corporate Bonds Total Debt Equity Total Sources 31.9% 31.9% 17.426% 19.165% Cost of Equity Calc Risk Free Rate (5 year) Premium based on MC = Beta = Expected Equity Return = 2.75% 10.00% 2.91x 31.9% LTM 12/31/2018 Debt Schedule Years 7 Rate 5.0% 9/30/2018 12/31/2019 12/31/2020 12/31/2021 12/31/2022 12/31/2023 12/31/2024 12/31/2025 Bank Loan Outstanding Scheduled Principal Payments (P) Interest Payments (I) Total Payments (P+I) 940,000 940,000 921,200 18,800 47,000 65,800 883,600 37,600 46,060 83,660 809,904 73,696 44,180 117,876 668,528 141,376 40,495 181,871 466,052 202,476 33,426 235,902 265,494 200,558 23,303 223,861 265,494 13,275 278,768 - - 47,000 47,000 10 8.0% Corporate Bonds Outstanding Scheduled Principal Payments (P) Interest Payments (I) Total Payments (P+I) 470,000 470,000 470,000 470,000 470,000 470,000 470,000 470,000 470,000 37,600 37,600 - - - - - - - - 37,600 37,600 37,600 37,600 37,600 37,600 37,600 37,600 37,600 37,600 37,600 37,600 37,600 37,600 1,410,000 84,600 84,600 18,800 103,400 1,391,200 83,660 37,600 121,260 1,353,600 81,780 73,696 155,476 1,279,904 78,095 141,376 219,471 1,138,528 71,026 202,476 273,502 936,052 60,903 200,558 261,461 735,494 50,875 265,494 316,368 470,000 Interest Payments Principal Payments Total Debt Payments Total Debt Outstanding - 84,600
AK Steel Holding Corp. (AKS) CORPORATE VALUATIONS METHOD #7 - Leveraged Buyout (LBO) Analysis METHOD #5 year = 1 2 3 4 5 6 Historical Assumptions Projected Assumptions Input Actual 9/30/2018 6,640,000 LTM 12/31/2018 6,905,600 EXIT YEAR 12/31/2022 7,962,617 Discout Cash Flow Valuation Analysis 12/31/2019 7,181,824 12/31/2020 7,433,188 12/31/2021 7,693,349 12/31/2023 8,281,121 Revenues Revenue Growth Cost of Revenues (CoGS) Operating Expenses (Excl. Non-rec.) EBIT Less Interest EBT Less Taxes (tax rate x of EBIT) Net Income Plus Depreciation Plus Amortization Less Working Capital Less Capex Cash Flow Before Principal Payment Debt Principal Payment Equity Cash Flows 4.0% 4.0% 3.5% 3.5% 3.5% 4.0% 87.7% 9.1% 86.0% 7.0% (5,820,800) (602,300) 216,900 (5,938,816) (483,392) 483,392 (84,600) 398,792 (143,565) 255,227 263,224 15,041 (171,496) 361,996 361,996 (6,176,369) (502,728) 502,728 (84,600) 418,128 (150,526) 267,602 273,753 15,041 (178,356) 378,040 (18,800) 359,240 (6,392,542) (520,323) 520,323 (83,660) 436,663 (157,199) 279,464 283,334 15,041 (184,598) 393,241 (37,600) 355,641 (6,616,280) (538,534) 538,534 (81,780) 456,754 (164,432) 292,323 293,251 15,041 (191,059) 409,556 (73,696) 335,860 (6,847,850) (557,383) 557,383 (78,095) 479,288 (172,544) 306,744 303,515 45,123 (197,746) 457,635 (141,376) 316,259 (7,121,764) (579,678) 579,678 (71,026) 508,652 (183,115) 325,537 315,655 216,900 253,100 216,900 36.0% - Enterprise Value = $3.3 3.8% 3.8% 7 Years 0.0% 2.5% 0.0% 2.5% - - - - - (205,656) 435,537 (202,476) 233,061 - (164,900) 305,100 - 305,100 470,000 2,030,000 746,616 1,410,000 776,481 1,391,200 803,657 1,353,600 831,785 1,279,904 860,898 1,138,528 895,334 936,052 EBITDA Debt Terminal Value EBITDA Multiple Method Perpetuity Method Average Less Debt Outstanding (at Exit) Plus Cash (at Exit) Equity Value at Terminal Assumptions Growth 5.30x 19.17% (EBITDA x EBITDA Multiple) 4.00% Next Year's Cash Flow / (Discount Rate - Growth) 4,560,874 2,871,977 3,716,425 (1,138,528) 2,577,897 - Desired Equity Return = Equity Cash Flows 35% 31.9% PV (1) = PV (2) = PV (3) = PV (4) = PV (5) = PV= 361,996 359,240 355,641 335,860 2,894,157 PV (for $1) 0.7407407 0.5486968 0.4064421 0.3010682 0.2230135 $268,145 $197,114 $144,548 $101,117 $645,436 $1,356,359 1 2 3 4 5 Enterprise Value = PV of Equity = + PV of Debt = + PV of Cash = PV of Equity + PV of Debt $1,356,359 2,030,000 (47,300) 3,339,059 Enterprise Value
AK Steel Holding Corp. (AKS) CORPORATE VALUATIONS ENTERPRISE VALUATION ANALYSIS SUMMARY VALUATION Equity Value Shares Outs Stock Price EV Debt 2,030,000 Cash 47,300 Book Value Equity 2,079,800 97,100 315,540 $ 0.31 METHOD #1 - Market Value / Using the Stock Price 2,960,874 2,030,000 47,300 978,174 315,540 $ 3.10 METHOD #2- Intrinsic Value METHOD #3- Dividend Discount Model (DDM) METHOD #4 -Average EBITDA Industry Trading Multiples METHOD #5 - Using Averge EBITDA Transaction Multiples METHOD #6 - Discount Cash Flow Valuation Analysis METHOD #7 - LBO Analysis 2,939,970 1,982,700 2,489,971 2,942,726 3,569,038 3,339,059 2,030,000 2,030,000 2,030,000 2,030,000 2,030,000 2,030,000 47,300 47,300 47,300 47,300 47,300 47,300 507,271 960,026 1,586,338 1,356,359 957,270 315,540 315,540 315,540 315,540 315,540 315,540 $ $ $ $ $ $ 3.03 - 1.61 3.04 5.03 4.30 - Premium 38.7% Average of other methods 2,814,213 2,030,000 47,300 831,513 $ 2.55 MARKET VALUE METHODS Valuation Methods 90 80 70 60 50 40 30 20 10 0 Dividend Current Market Comparable Comparable DCF Analysis Discount Intrinsic Value Acquisition Model Multiples Multiples Trading Price Price
MERGING WITH A PUBLICLY TRADED COMPANY FIRST ROUND PROCESS (SEC DRIVEN) Contact Prospective Buyers Negotiate and Execute Confidentiality Agreements with Interested Parties Distribute Confidential Information Memorandum and Initial Bid Procedures Letter Prepare Management Presentation Set up Data Room Prepare Stapled Financing Package (if applicable) Receive Initial Bids and Select Buyers to Proceed to Second Round
MERGING WITH A PUBLICLY TRADED COMPANY SECOND ROUND PROCESS (SEC DRIVEN) Contact Management Presentations Facilitate Site Visits Provide Data Room Access Distribute Final Bid Procedures Letter and Draft Definitive Agreement Receive Final Bids
Merging with a publicly traded company Accretion & Dilution Analysis
WORKSHOP (MEET AT THE COMPUTER LAB) THE INSTRUCTOR WILL PROVIDE CASE STUDIES FOR VALUATION AND DUE DILLIGENCE REVIEW THE STUDENTS WILL HAVE A CHANCE TO REVIEW THE COMPANY AND PERFORM VALUATIONS


")


")


")

")
")
")


")