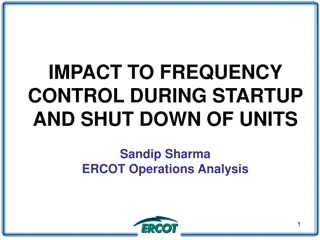
Managing Frequency Control Concerns Due to Poor IRR Telemetry
Addressing issues with poor telemetry affecting frequency control in the power system, especially in managing Intermittent Renewable Resources (IRR) under curtailment due to inaccurate Real Time Power Potential (RTPP) calculations. SCR819 was implemented to improve control and prevent exceeding Stability Limits, but challenges persist. Learn about the impact of inaccurate telemetry and curtailment logic through real-world examples, highlighting deviations in expected generation and operational implications.

Download Presentation

Please find below an Image/Link to download the presentation.
The content on the website is provided AS IS for your information and personal use only. It may not be sold, licensed, or shared on other websites without obtaining consent from the author. If you encounter any issues during the download, it is possible that the publisher has removed the file from their server.
You are allowed to download the files provided on this website for personal or commercial use, subject to the condition that they are used lawfully. All files are the property of their respective owners.
The content on the website is provided AS IS for your information and personal use only. It may not be sold, licensed, or shared on other websites without obtaining consent from the author.
E N D
Presentation Transcript
FREQUENCY CONTROL CONCERNS DUE TO POOR IRR TELEMETRY UNDER CURTAILMENT Luis Hinojosa Ancillary Services & Operations Analytics DECEMBER 6, 2024 CMWG
SCR819 - Improving IRR Control to Manage GTC Stability Limits SCR819 was implemented on May 31, 2024 to improve GTC management Additional logic was implemented to instruct all Intermittent Renewable Resource (IRR) behind a binding GTC not to exceed (NTE) its Base Point. This would apply to all IRR units behind a binding GTC with a shift factor impact greater than 2% on the GTC flow should NOT exceed their SCED BP when NTE is triggered. With outage season now in full effect we have seen an increase in curtailment and additionally more NTE curtailments related to SCR819. These additional curtailments are now sent to a broader fleet of IRRs which in the past may not have seen curtailments. ERCOT has observed that many of the IRRs which are now receiving curtailment flags have issues related to their Real Time Power Potential (RTPP) calculation which is sent via HSL telemetry during curtailment only. This inaccuracy of HSL telemetry has brought on frequency control concerns as the RTPP that is being sent to ERCOT is unrealistic/undeliverable, but SCED is utilizing the telemetry to send dispatch instruction. This has lead to many dragging frequency periods, regulation exhaustion, and additional manual operator actions. Data in the following deck will represent information related to the impact of poor telemetry into our system beginning the week of October 28thwhen we began seeing concerns. 2 PUBLIC 2
Example: Poor HSL Telemetry (Increase) Unit is operating at 85 MW (red) and receives a curtailment signal. HSL jumps to 110 MW (green) and SCED pick up this HSL in the next run and sends a new BP (pink) instruction The unit is never able to respond to that new setpoint. HSL drops after the curtailment instruction is removed. 3 PUBLIC 3
Example: Poor HSL Telemetry (Reduction) Unit Drops its HSL to 0 (green) when they receive a curtailment signal SCED picks up the HSL in the next run and dispatches them down and they reduce output 4 PUBLIC 4
Example: Poor Curtailment Logic Units curtail them self to 0 MW (red)when they receive an NTE instruction instead of not exceeding their BP. We have ~150 MW of Expected Generation Deviation with these 2 units alone. 5 PUBLIC 5
Example: Curtailment Ignored These 2 units receive a curtailment close to 0 at 2:50pm, but ignore the dispatch for 15 mins Approximately 200 MW of expected generation deviation This contributed to an exceedance of a IROL for 5 mins. 6 PUBLIC 6
Example: No ramp after release This unit is curtailed to 0 at 09:00 They are still curtailed but get an NTE BP of 140 MW. Units takes roughly 3 minutes to start ramping, but never reaches 140 MW BP. 7 PUBLIC 7
Location of Telemetry Issues Telemetry issues are broadly spread across Texas and not associated to one particular GTC 8 PUBLIC 8
RFI Summary Ops Analysis began sending RFIs on November 1st RFI s have been sent to 61 Resources (55 QSEs) As of 12/5/24: RFI responses have been received for 58 Resources. No response from 3 resources Only 17 Resources have acknowledged and addressed the issue 41 Resources acknowledged, but did not address the issue or working with their OEM s to address the issue Ops Analysis continues to review for Resources with telemetry issues An additional set of 70 Resources have been identified to have telemetry issues when curtailed and will need corrective actions. Some of these units are under a QSE which already has received the previous RFI We are preparing to reach out to those that have not had an RFI yet. 9 PUBLIC 9
Time Error (TE) Loss Time Error Began sliding quickly starting on 10/28/24 Manual Time Error Correction actions are taken at -30 seconds 10 PUBLIC 10
High Curtailment We were able to correlate Time Error Loss to high curtailment periods Some Manual actions taken to help recover TE 11 PUBLIC 11
System Summary of Frequency Control High correlation of dragging frequency with suspiciously high step changes in curtailment Regulation Up is consistently exhausted during these periods PRC is oscillating when we see step changes in curtailment Additionally, this is leading to the need for more Operator Manual Offsets to help recover frequency 12 PUBLIC 12
Daily CPS1 with TE (10/1/24-12/1/24) 13 PUBLIC 13
Regulation Up Exhaustion 2023 2024 2024-2023 HE 1 2 3 4 5 6 7 8 9 10 11 12 13 14 15 16 17 18 19 20 21 22 23 24 Oct 3.2% 2.2% 0.0% 3.8% 1.1% 0.8% 0.3% 0.8% 0.8% 0.3% 0.3% 1.3% 0.3% 0.0% 0.0% 0.0% 0.0% 1.3% 2.4% 1.3% 1.1% 1.6% 6.5% 4.3% Nov 3.1% 1.9% 3.1% 1.4% 1.1% 0.6% 0.0% 3.1% 1.4% 1.7% 1.4% 0.8% 0.6% 0.6% 0.0% 0.0% 0.0% 0.8% 3.1% 5.3% 3.9% 7.5% 5.3% 4.7% HE 1 2 3 4 5 6 7 8 9 10 11 12 13 14 15 16 17 18 19 20 21 22 23 24 Oct 16.7% 10.4% 6.3% 8.3% 8.3% 6.3% 4.2% 2.1% 16.7% 8.3% 0.0% 0.0% 0.0% 0.0% 2.1% 6.3% 4.2% 0.0% 0.0% 12.5% 27.1% 12.5% 20.8% 14.6% Nov 8.3% 1.9% 1.7% 0.8% 1.4% 0.0% 0.0% 3.6% 3.3% 1.4% 0.6% 2.2% 2.8% 2.8% 2.2% 1.1% 0.6% 0.0% 0.0% 7.8% 6.4% 3.1% 8.9% 1.9% HE 1 2 3 4 5 6 7 8 9 10 11 12 13 14 15 16 17 18 19 20 21 22 23 24 Oct 13.4% 8.3% 6.3% 4.6% 7.3% 5.4% 3.9% 1.3% 15.9% 8.1% -0.3% -1.3% -0.3% 0.0% 2.1% 6.3% 4.2% -1.3% -2.4% 11.2% 26.0% 10.9% 14.4% 10.3% Nov 5.3% 0.0% -1.4% -0.6% 0.3% -0.6% 0.0% 0.6% 1.9% -0.3% -0.8% 1.4% 2.2% 2.2% 2.2% 1.1% 0.6% -0.8% -3.1% 2.5% 2.5% -4.4% 3.6% -2.8% 14 PUBLIC 14
Regulation Down Exhaustion 2023 2024 2024-2023 HE 1 2 3 4 5 6 7 8 9 10 11 12 13 14 15 16 17 18 19 20 21 22 23 24 Oct 1.3% 7.8% 7.8% 6.6% 4.3% 2.3% 3.2% 2.0% 0.1% 0.3% 1.3% 1.1% 3.6% 1.1% 0.5% 1.3% 1.2% 0.8% 1.3% 5.1% 4.7% 1.2% 0.5% 0.4% Nov 3.2% 12.2% 13.5% 14.9% 6.9% 7.6% 5.7% 0.0% 1.1% 1.4% 5.0% 2.5% 2.1% 1.4% 1.4% 5.0% 3.3% 8.5% 13.9% 7.1% 4.4% 2.9% 1.7% 3.3% HE 1 2 3 4 5 6 7 8 9 10 11 12 13 14 15 16 17 18 19 20 21 22 23 24 Oct 0.0% 12.5% 0.0% 10.4% 14.6% 4.2% 0.0% 0.0% 0.0% 4.2% 0.0% 0.0% 0.0% 0.0% 0.0% 0.0% 0.0% 4.2% 6.3% 4.2% 0.0% 2.1% 0.0% 0.0% Nov 4.7% 15.3% 16.9% 20.0% 10.3% 10.6% 8.1% 0.0% 0.3% 0.6% 3.3% 0.8% 1.9% 0.8% 1.7% 3.1% 4.2% 2.5% 17.8% 6.7% 4.2% 3.9% 2.2% 3.6% HE 1 2 3 4 5 6 7 8 9 10 11 12 13 14 15 16 17 18 19 20 21 22 23 24 Oct -1.3% 4.7% -7.8% 3.8% 10.3% 1.9% -3.2% -2.0% -0.1% 3.9% -1.3% -1.1% -3.6% -1.1% -0.5% -1.3% -1.2% 3.4% 4.9% -0.9% -4.7% 0.9% -0.5% -0.4% Nov 1.5% 3.1% 3.5% 5.1% 3.3% 2.9% 2.4% 0.0% -0.8% -0.8% -1.7% -1.7% -0.1% -0.6% 0.3% -1.9% 0.8% -6.0% 3.9% -0.4% -0.3% 1.0% 0.6% 0.3% 15 PUBLIC 15
Review of Manual Operator Actions Overall increase in number of intervals where an Operator Manual Offset was in place in comparison to the same month from last year. 89% of intervals in October 2024 occurred in the last 4 days of October 16 PUBLIC 16
GTBD ACE Integral Adjustments Ops Analysis and Control Room have been working to adjust Generation To Be Dispatched (GTBD) application to battle the frequency concerns and loss of Time Error. These changes adjust the amount of impact Ace Integral Feedback to GTBD in pushing additional MWs in to SCED dispatch. This is an artificial adjustment to regain TE in order to counter bad telemetry. This forces Frequency to be high, impacts SCED dispatch and requires more frequent governor action. Ace Integral K Factor Change Date Time Error Starting Parameters 0.5 -1.0s 10/31/2024 1.0 -22s 11/1/2024 0.75 -11s 11/5/2024 0.5 -3.9s 11/18/2024 0.75 -15s 11/22/2024 0.5 -0.5s 17 PUBLIC 17
Next Steps At this point our frequency control is being impacted by poor telemetry being sent to ERCOT by curtailed IRR units. We have sent out RFIs to get corrective actions, but we are not seeing action being taken fast enough. As we continue to monitor, we find more units that need outreach Operators are taking more manual actions with SCED offsets, Ops Analysis has taken manual action in adjusting GTBD to artificially maintain higher frequency, regulation is being exhausted and not available for other needs, and PRC is including headroom that is not available. At this moment, any Market Participants who have not responded to our RFIs or implemented corrective actions will be sent to Compliance and Reliability Monitor. Additionally, the control room is prepared to take additional manual action including bringing units offline when an IRR is identified to contributing to reliability concerns. 18 PUBLIC 18
QUESTIONS? PUBLIC 19 19


")
")


 Loss")


")