Managing Overseas Student Revenue Losses: Australian Universities Resilience Study
Explore a study by Ian Marshman and Frank Larkins from the University of Melbourne on how Australian universities managed overseas student revenue losses during the COVID-19 pandemic. The study delves into revenue trends, financial resilience, and key questions for modelling university resilience to financial challenges.

Download Presentation

Please find below an Image/Link to download the presentation.
The content on the website is provided AS IS for your information and personal use only. It may not be sold, licensed, or shared on other websites without obtaining consent from the author. If you encounter any issues during the download, it is possible that the publisher has removed the file from their server.
You are allowed to download the files provided on this website for personal or commercial use, subject to the condition that they are used lawfully. All files are the property of their respective owners.
The content on the website is provided AS IS for your information and personal use only. It may not be sold, licensed, or shared on other websites without obtaining consent from the author.
E N D
Presentation Transcript
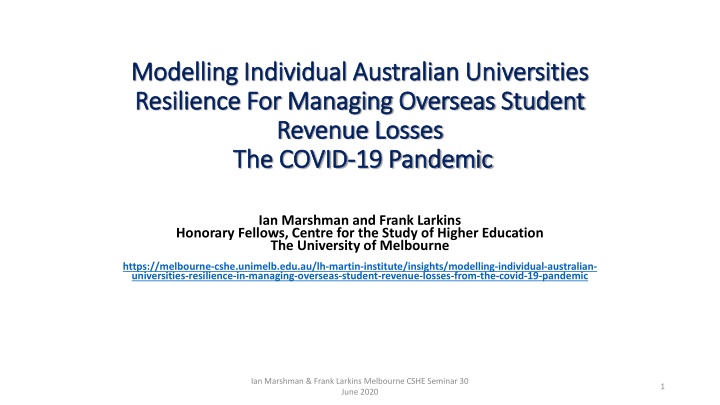
Modelling Individual Australian Universities Modelling Individual Australian Universities Resilience For Managing Overseas Student Resilience For Managing Overseas Student Revenue Losses Revenue Losses The COVID The COVID- -19 Pandemic 19 Pandemic Ian Marshman and Frank Larkins Honorary Fellows, Centre for the Study of Higher Education The University of Melbourne https://melbourne-cshe.unimelb.edu.au/lh-martin-institute/insights/modelling-individual-australian- universities-resilience-in-managing-overseas-student-revenue-losses-from-the-covid-19-pandemic Ian Marshman & Frank Larkins Melbourne CSHE Seminar 30 June 2020 1
Context for Study: Context for Study: Australian Universities collectively has been Australian Universities collectively has been very successful in raising revenue in the decade 2009 to 2018 very successful in raising revenue in the decade 2009 to 2018 Total Revenue has increased by $13.5 billion (66%) over the decade to $33.9 billion in 2018. Overseas Student Fee Revenue has increased by $5.4 billion (158%) to $8.8 billion 26% of total revenue Domestic Student Fee Revenue has increased by $0.5 billion (41%) to $1.8 billion 5% of total revenue Other Income, including government funding, increased by $7.5 billion (48%) to $23.3 billion 69% of total revenue Ian Marshman & Frank Larkins Melbourne CSHE Seminar 30 June 2020 2
Australian Universities Revenue Increases 2009 to 2018 Australian Universities Revenue Increases 2009 to 2018 Total Revenue $ Billions $33.9 $32.0 $30.1 $28.6 $27.6 $26.3 $25.2 $23.7 $22.2 $20.5 2009 2010 2011 2012 2013 2014 2015 2016 2017 2018 Ian Marshman & Frank Larkins Melbourne CSHE Seminar 30 June 2020 3
AUSTRALIAN UNIVERSITIES REVENUES 2009 AND 2018 $ BILLIONS Other Revenue Domestic Student Fees Total $33.9b Overseas Student Fees Total $20.5b $23.3b $1.8b $15.8b $1.2b $8.8b $3.4b 2009 2018 Ian Marshman & Frank Larkins Melbourne CSHE Seminar 30 June 2020 4
Key Questions for Modelling Study: Key Questions for Modelling Study: What proportion of annual revenue for each of the 38 Australian Universities comes from overseas student fee revenue? How financially secure are Australian Universities in terms of their Cash and Investment Reserves (as distinct from net assets)? How do annual expenses compare with university cash and investment reserves? 2018 Department of Education data used for this study. The answers to these questions help to define the resilience of a particular university to withstand unplanned financial losses. Ian Marshman & Frank Larkins Melbourne CSHE Seminar 30 June 2020 5
Modelling Assumptions and Limitations Modelling Assumptions and Limitations Assumptions Based on latest published Dept Education 2018 enrolment data Cash and Investment Reserves provide line of sight into university liquidity Universities consistently able to free up 33.3% in short term and 66.7% in longer term of cash and reserves (or the equivalent) to offset revenue losses Each university impacted in same way and has same flexibility with respect to use of reserve funds Limitations A desk-top, modelling study No consultation with universities All international fee income treated equally regardless of mode of delivery Study undertaken April/early May 2020 based on what known at time Ian Marshman & Frank Larkins Melbourne CSHE Seminar 30 June 2020 6
Overseas Student Revenues Range from $885million (Sydney) to $5m (Notre Dame) Overseas Student Revenues Range from $885million (Sydney) to $5m (Notre Dame) Grouping of Australian Universities According to Overseas Student Fee Revenue Grouping of Australian Universities According to Overseas Student Fee Revenue Group A Universities Fee Revenue >$500 m Sydney Melbourne Group B Universities Fee Revenue $200m to $500m RMIT UTS Group C Universities Fee Revenue $100m to $200m Griffith Wollongong Group D Universities Fee Revenue < $100m Flinders Victoria Group A Universities Fee Revenue >$500 m Sydney Melbourne Monash UNSW Queensland ANU Macquarie Adelaide QUT Group B Universities Fee Revenue $200m to $500m RMIT UTS Deakin ANU Macquarie Adelaide QUT Group C Universities Fee Revenue $100m to $200m Griffith Wollongong Curtin Charles Sturt La Trobe Swinburne UWA Central Queensland Western Sydney Federation Uni South Australia Tasmania Newcastle Edith Cowan Western Sydney Federation Uni South Australia Tasmania Newcastle Edith Cowan June 2020 Group D Universities Fee Revenue < $100m Flinders Victoria James Cook Southern Cross Aus Catholic Uni Sunshine Coast Murdoch Canberra Southern Queensland Charles Darwin New England Notre Dame Canberra Southern Queensland Charles Darwin New England Notre Dame Monash Deakin Curtin James Cook UNSW Queensland Charles Sturt La Trobe Swinburne UWA Central Queensland Southern Cross Aus Catholic Uni Sunshine Coast Murdoch Ian Marshman & Frank Larkins Melbourne CSHE Seminar 30 7
Thirteen Universities have 2018 Fee Revenue More than Thirteen Universities have 2018 Fee Revenue More than three times 2009 Result 2009 Result three times the the 9.0 5.5 5.0 4.7 3.8 3.7 3.5 3.3 3.2 3.2 3.1 3.1 3.0 Tasmania Queensland Deakin UT Sydney Monash Ian Marshman & Frank Larkins Melbourne CSHE Seminar 30 June 2020 Melbourne NSW Sydney S. Cross ANU Sunshine C Charles D. Charles S. 8
Federation 38.6% Overseas Revenue as % Total Revenue 2018 Nine Universities sourced more than 30% of their 2018 revenue from overseas student fees: Federation 38.6% RMIT 36% Sydney 35.4% Melbourne 34.7% UTS 34.5% Monash 34.1% UNSW 33.4% CQU 33.0% Macquarie 30.6% RMIT 36.0% Sydney 35.4% Melbourne 34.7% UT Sydney 34.5% Monash 34.1% NSW 33.4% CQU 33.0% Macquarie 30.6% Queensland 29.1% Deakin 28.7% Southern C. 27.4% All Unis 26.2% Charles S. 26.0% Wollongong 25.7% Adelaide 24.9% ANU 24.0% Edith Cowan 22.4% Sun. Coast 22.0% Swinburne 21.7% QUT 20.6% Victoria 20.0% La Trobe 19.8% USA 18.8% Griffith 18.7% Flinders 18.5% Canberra 18.4% Curtin 18.4% UWA 16.5% Murdoch 16.2% Tasmania 15.3% Newcastle 14.9% James Cook 14.7% West. Syd 14.6% Charles D. 14.1% South'n Qld 13.8% ACU 12.8% Ian Marshman & Frank Larkins Melbourne CSHE Seminar 30 June 2020 New England 7.7% 9 Notre Dame 5.1%
Proportion of 2018 Expenditure in relation to the 2018 Cash and Investments held by Australian Universities Seven Universities have annual expenditure more than three times Cash and Investment Reserves: RMIT 8.6 times Notre Dame 6.3 times Canberra 5.6 times La Trobe 5.3 times UTS 4.8 times Southern Cross 4.2 times Monash 3.6 times RMIT 8.59 Notre Dame 6.32 Canberra 5.64 La Trobe 5.30 UT Sydney 4.80 Southern C. 4.16 Monash 3.59 ACU 2.78 USA 2.74 Charles D. 2.69 Victoria 2.54 CQU 2.51 Flinders 2.35 Adelaide 2.32 Sun. Coast 2.24 New England 2.20 West. Syd 2.19 Swinburne 2.10 NSW 2.09 Macquarie 1.93 Queensland 1.92 James Cook 1.82 Charles S. 1.75 South'n Qld 1.74 QUT 1.64 All Unis 1.59 Griffith 1.49 Newcastle 1.47 Curtin 1.38 Deakin 1.38 Tasmania 1.13 Sydney 1.12 Wollongong 1.08 Edith Cowan 1.07 Federation 1.03 UWA 1.00 Melbourne 0.85 Ian Marshman & Frank Larkins Melbourne CSHE Seminar 30 June 2020 10 Murdoch 0.78 ANU 0.62
Resilience of Universities to Manage the Unexpected Resilience of Universities to Manage the Unexpected The data presented in the last two slides were used to identify the most potentially vulnerable universities at most risk. They are: Monash RMIT University of Technology Sydney Ian Marshman & Frank Larkins Melbourne CSHE Seminar 30 June 2020 11
Three scenarios modelled Three scenarios modelled - - Assumptions Assumptions Short term Impact for 2020 1.Overseas student fee loss in 2020 equal to 40% of 2018 overseas fee revenue 2.The equivalent of one-third of 2018 cash and investments available to mitigate the losses. Longer term to 2023 Optimistic Case 1. Cumulative revenue shortfall over four years to 2023 will be 130% of 2018 overseas fee revenue. 2. The equivalent of two-third of 2018 cash and investments available to mitigate the losses. Longer term to 2024 Pessimistic Case 1. Cumulative revenue shortfall over five years to 2024 will be 205% of 2018 overseas fee income 2. The equivalent of two-third of 2018 cash and investments available to mitigate the losses. Ian Marshman & Frank Larkins Melbourne CSHE Seminar 30 June 2020 12
Optimistic Scenario Borders remain closed in 2020. Re-opening of borders commences on selective basis from early 2021. International demand for on-shore university education not greatly diminished. A further decline in international student enrolments in 2021 Student recruitment activities will resume in 2021. Numbers will return to pre-COVID-19 levels by 2024. Pessimistic Scenario Impact of virus is both significant and enduring. Restrictions on entry persist until vaccine /effective mode of treatment emerges later in 2021 A foreign country imposing a ban on its citizens travelling to Australia A further decline in international student enrolments in 2021. Globally longer term decline in demand for international education Increased competition from more established/recognised global on-line providers Australian universities lose market share in terms of both numbers and price. NB latest QANTAS advice: minimal international travel before mid 2021 Ian Marshman & Frank Larkins Melbourne CSHE Seminar 30 June 2020 13
Short Term Short Term - - Sector Wide Outcome 38 Universities Sector Wide Outcome 38 Universities $6.8b $3.3b A. Fee Loss in 2020 B One Third Cash & Invest. Difference C&I - Loss (B-A) -$3.5b Conclusion: Sector-wide the losses can be covered, but not so for all individual universities Ian Marshman & Frank Larkins Melbourne CSHE Seminar 30 June 2020 14
Longer Term Longer Term Sector Wide Outcomes 38 Universities Sector Wide Outcomes 38 Universities $13.5b $2.0b Cash & Investments Available Losses- Optimistic Scenario Losses- Pesimistic Scenario Net Gain - Optimistic Net Loss- Pessimistic $-4.6b $-11.5b $-18.1b Conclusion: Optimistic and Pessimistic Losses are substantial. $11 to $18 billion The sector has insufficient cash & investment reserves to cover the pessimistic scenario losses Ian Marshman & Frank Larkins Melbourne CSHE Seminar 30 June 2020 15
Five Group A Universities Predicted Losses in 2020: Net Financial Position Five Group A Universities Predicted Losses in 2020: Net Financial Position if 33.3% of 2018 Cash and Investments (or Equivalent) Are Available ($m) if 33.3% of 2018 Cash and Investments (or Equivalent) Are Available ($m) $970m $692m $618m $338m $338m $329m $217m $100m $53m -$229m -$124m -$285m -$352m -$354m -$341m Monash Sydney Melbourne NSW Queensland A. Fee Loss in 2020 B One Third Cash & Invest. Difference C&I - Loss (B-A) Monash carries the highest short term risk of this group Ian Marshman & Frank Larkins Melbourne CSHE Seminar 30 June 2020 16
Five Group A Universities Predicted Losses to 2024: Net Financial Position Five Group A Universities Predicted Losses to 2024: Net Financial Position if 66.6% of 2018 Cash and Investments Are Available ($m) if 66.6% of 2018 Cash and Investments Are Available ($m) $1,813 $1,803 $1,747 $1,461 $1,150 $1,108 $1,143 $1,174 $926 $797 $745 $234 $137 Sydney Melbourne Monash NSW -$251 Queensland -$86 -$429 -$515 -$675 -$786 -$1,314 Net Funds -Optimistic Optimistic Scenario Pesimistic Scenario Net Funds- Pessimistic Sydney, Monash, New South Wales and Queensland are all financially vulnerable with this model. Ian Marshman & Frank Larkins Melbourne CSHE Seminar 30 June 2020 17
Australias High Risk Most Financially Challenged Universities $ m Australia s High Risk Most Financially Challenged Universities $ m Monash RMIT UT Sydney La Trobe -$228 CQU -$180 Southern Cross Canberra -$82 -$108 -$72 -$336 -$40 -$53 -$109 -$505 -$608 -$675 -$853 -$1314 Net Funds -Optimistic Net Funds- Pessimistic These are the seven universities assessed as being in the highest risk category Ian Marshman & Frank Larkins Melbourne CSHE Seminar 30 June 2020 18
Classification of Universities according to level of Financial Risk Classification of Universities according to level of Financial Risk in managing COVID in managing COVID- -19 induced Fee Losses 19 induced Fee Losses High Risk Monash (Group A) RMIT (Group B) UTS (Group B) La Trobe (Group C) Central Queensland (Group C) Southern Cross (Group D) Canberra (Group D) Medium Risk UNSW Queensland Deakin Macquarie Adelaide QUT Charles Sturt Swinburne Uni South Australia Flinders Victoria Sunshine Coast Federation Low Risk Cluster I Melbourne ANU Griffith Wollongong Curtin UWA Tasmania Newcastle Edith Cowan James Cook Murdoch Southern Queensland New England Cluster II Sydney Western Sydney ACU Charles Darwin Notre Dame Ian Marshman & Frank Larkins Melbourne CSHE Seminar 30 June 2020 19
Overall Conclusion from the Modelling Overall Conclusion from the Modelling All 38 Australian Universities face significant financial management challenges: longer term challenges are the most serious Despite years of plenty, most universities have not built large buffers Universities most vulnerable are those (a) with largest international enrolments and/or (b) inadequate cash and investment reserves Relative vulnerability crosses usual fault lines within the sector, i.e. smaller or regional universities generally not those most at risk Three universities may be facing existential crisis: LaTrobe, Southern Cross and Canberra. c.f. Federation, Southern Qld, Newcastle Lasting damage to Aust university research and research training Eventual government response pivotal in determining whether a fundamental redesign of UNS is to occur Ian Marshman & Frank Larkins Melbourne CSHE Seminar 30 June 2020 20
Possible University Actions: Expenditure Management Possible University Actions: Expenditure Management Delay or scaling back of uncommitted capital works and other major projects. Fixed assets review? Cash flow management. Borrowing funds against net assets Other Expenditure savings: travel, entertainment, consultants, marketing Reappraisal of head office structures and remuneration levels. Review of administrative and professional staff costs ($8.6 billion in 2018) Reduction in staffing levels to reflect reduced student enrolment numbers and adjust workforce capabilities to changed future requirements. Multiple campuses universities to review of the viability of each campus A rationalization of course and subject offerings to ensure individual program viability Ian Marshman & Frank Larkins Melbourne CSHE Seminar 30 June 2020 21
Possible University Actions: Revenue Growth Initiatives Possible University Actions: Revenue Growth Initiatives Enthusiastic take up of any Aust Govt program growth, c.f. marginally funded short course initiative. Exploit domestic revenue growth options within Job-Ready Package Short term investment in international student recruitment and retention including funded quarantine accommodation Invest in more digital education Creation of new forms of student experience capable of attracting and retaining both domestic and international markets Targeted government support for some universities and for selective programs, including R&D and other stimulus initiatives Increased co-operation between institutions sharing infrastructure and teaching curriculum materials and research resources. Ian Marshman & Frank Larkins Melbourne CSHE Seminar 30 June 2020 22
Possible Government Actions Possible Government Actions To date HE COVID-19 Rescue Package: Funding for Short Courses etc Significant pushback: international student excluded from living support; JobKeeper eligibility for universities PM: promised boost for VET China trade relations response Job-ready Graduate Reform Package: limited if any funding growth; pivot towards domestic Minister: Aust unis are resilient ; EY view that Aust poised to capture 2% extra market share of FFOS market Increased regulation: integrity function for TEQSA Ian Marshman & Frank Larkins Melbourne CSHE Seminar 30 June 2020 23
Thank You Thank You Ian Marshman i.marshman@unimelb.edu.au Frank Larkins f.larkins@unimelb.edu.au Higher Education Policy articles at: https://melbourne-cshe.unimelb.edu.au/lh-martin-institute or at https://franklarkins.wordpress.com Ian Marshman & Frank Larkins Melbourne CSHE Seminar 30 June 2020 24


 to")