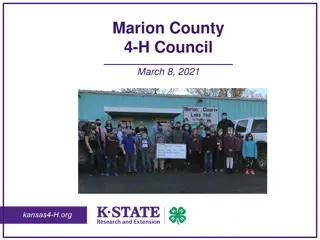
Marion County Consolidated Plan & Fair Housing Forum

This forum focuses on reviewing fair housing protections, introducing the Affirmatively Furthering Fair Housing rule, presenting fair housing data, and gathering input through a survey. Discussions cover federal and state fair housing acts, the Analysis of Impediments, demographics including a growing and aging population, and population by race and ethnicity. Your role involves providing feedback, local knowledge, asking questions, and making recommendations to further fair housing initiatives.

Download Presentation

Please find below an Image/Link to download the presentation.
The content on the website is provided AS IS for your information and personal use only. It may not be sold, licensed, or shared on other websites without obtaining consent from the author.If you encounter any issues during the download, it is possible that the publisher has removed the file from their server.
You are allowed to download the files provided on this website for personal or commercial use, subject to the condition that they are used lawfully. All files are the property of their respective owners.
The content on the website is provided AS IS for your information and personal use only. It may not be sold, licensed, or shared on other websites without obtaining consent from the author.
E N D
Presentation Transcript
2021-2025 Marion County Consolidated Plan and Analysis of Impediments Welcome to the Fair Housing Forum!
Intent of this Meeting Review fair housing protections Introduce you the Affirmatively Furthering Fair Housing (AFFH) rule Show you fair housing data Introduce the Survey! Get your input and opinions
Your Role Provide Feedback on the process Offer your observations and local knowledge Ask questions! Give recommendations
Fair Housing Protections Federal and State Fair Housing Acts protect several groups in housing transactions. These are: Race, color, religion, national origin, sex, disability, and familial status Source of income, marital status, sexual orientation, and gender
Marion County Analysis of Impediments (AI) Entitlement jurisdictions must: Certify that they are affirmatively furthering fair housing (AFFH) as a condition of receiving federal funds for housing from HUD
Demographics Growing Population Population by Race and Ethnicity Marion County Service Area 2010 Census & 2019 Five-Year ACS Total Households 65,098 68,030 Total Population 184,937 197,430
Demographics Aging Population What Implications does that have on services and housing needs?
Demographics Not much change in racial and ethnic makeup Population by Race and Ethnicity Marion County Service Area 2010 Census & 2019 Five-Year ACS 2010 Census Population 145,260 1,265 2,949 2,500 2019 Five-Year ACS Population 161,475 2,106 1,626 3,309 Race % of Total 78.5% 0.7% 1.6% 1.4% % of Total 81.8% 1.1% 0.8% 1.7% White Black American Indian Asian Native Hawaiian/ Pacific Islander Other Two or More Races Total Non-Hispanic Hispanic 963 0.5% 882 0.4% 25,418 6,582 184,937 136,884 48,053 13.7% 3.6% 100.0% 74.0% 26.0% 15,296 12,736 197,430 142,866 54,564 7.7% 6.5% 100.0% 72.4% 27.6%
Demographics Disability Rate Disability by Age Marion County Service Area 2019 Five-Year ACS Data Over half of people over 75 have a disability Male Female Total Age Disabled Population 17 1,267 1,564 4,719 2,600 3,105 13,272 Disability Rate 0.3% 6.9% 7.2% 13.4% 30.1% 52.6% 13.8% Disabled Population 60 638 1,563 5,625 2,795 3,794 14,475 Disability Rate 0.9% 3.5% 7.7% 15.2% 26.3% 50.9% 14.5% Disabled Population 77 1,905 3,127 10,344 5,395 6,899 27,747 Disability Rate 0.6% 5.2% 7.5% 14.3% 28.0% 51.7% 14.1% Under 5 5 to 17 18 to 34 35 to 64 65 to 74 75 or Older Total
Economics Households by Income Marion County Service Area 2010 & 2019 Five-Year ACS Data Incomes are Rising 2010 Five-Year ACS Households 3,532 3,149 3,796 4,025 3,606 3,666 3,649 3,915 3,379 6,177 7,695 8,505 4,573 1,834 1,758 1,459 64,718 2019 Five-Year ACS Households 2,521 2,461 2,673 3,025 2,993 3,403 3,181 2,762 3,603 5,410 8,207 10,197 6,579 3,916 4,321 2,778 68,030 Income % of Total 5.5% 4.9% 5.9% 6.2% 5.6% 5.7% 5.6% 6.0% 5.2% 9.5% 11.9% 13.1% 7.1% 2.8% 2.7% 2.3% 100.0% % of Total 3.7% 3.6% 3.9% 4.4% 4.4% 5.0% 4.7% 4.1% 5.3% 8.0% 12.1% 15.0% 9.7% 5.8% 6.4% 4.1% 100.0% Less than $10,000 $10,000 to $14,999 $15,000 to $19,999 $20,000 to $24,999 $25,000 to $29,999 $30,000 to $34,999 $35,000 to $39,999 $40,000 to $44,999 $45,000 to $49,999 $50,000 to $59,999 $60,000 to $74,999 $75,000 to $99,999 $100,000 to $124,999 $125,000 to $149,999 $150,000 to $199,999 $200,000 or more Total Households making at least $60k a year increasing
Economics Poverty is decreasing Poverty by Age Marion County Service Area 2010 & 2019 Five-Year ACS Data 2010 Five-Year ACS Persons in Poverty 3,986 7,232 13,221 1,802 26,241 14.6% 2019 Five-Year ACS Persons in Poverty 2,624 6,058 13,521 1,916 24,119 12.3% Age % of Total % of Total Under 6 6 to 17 18 to 64 65 or Older Total Poverty Rate 24.9% 22.1% 12.4% 7.5% 100.0% . 17.2% 18.2% 11.8% 5.9% 100.0% .
Housing Types of Housing Not Changing Much Housing Units by Type Marion County Service Area 2010 & 2019 Five-Year ACS Data 2010 Five-Year ACS Units 48,099 2,164 3,434 7,980 6,637 144 68,458 2019 Five-Year ACS Units 50,591 2,182 3,722 8,376 7,620 201 72,692 Unit Type % of Total 70.3% 3.2% 5.0% 11.7% 9.7% 0.2% 100.0% % of Total 69.6% 3.0% 5.1% 11.5% 10.5% 0.3% 100.0% Single-Family Duplex Tri- or Four-Plex Apartment Mobile Home Boat, RV, Van, Etc. Total
Housing Owner-occupied Units Maintaining Housing Units by Tenure Marion County Service Area 2010 Census & 2019 Five-Year ACS Data 2010 Census 2019 Five-Year ACS Tenure Units % of Total Units % of Total Occupied Housing Units 65,098 93.4% 68,030 93.6% Owner-Occupied 43,183 66.3% 44,890 66.0% Renter-Occupied 21,915 33.7% 23,140 34.0% Vacant Housing Units 4,634 6.6% 4,662 6.4% Total Housing Units 69,732 100.0% 72,692 100.0%
Housing Majority of Units build between 1960 and 2010 Households by Year Home Built Marion County Service Area 2010 & 2019 Five-Year ACS Data 2010 Five-Year ACS Households 4,528 2,531 4,673 7,999 16,888 7,245 13,047 7,807 . 64,718 2019 Five-Year ACS Households 4,620 2,102 4,214 7,565 17,670 6,890 12,545 9,921 2,503 68,030 Year Built % of Total 7.0% 3.9% 7.2% 12.4% 26.1% 11.2% 20.2% 12.1% . 100.0% % of Total 6.8% 3.1% 6.2% 11.1% 26.0% 10.1% 18.4% 14.6% 3.7% 100.0% 1939 or Earlier 1940 to 1949 1950 to 1959 1960 to 1969 1970 to 1979 1980 to 1989 1990 to 1999 2000 to 2009 2010 or Later Total
Housing Other vacant units are increasing Disposition of Vacant Housing Units Marion County Service Area 2010 Census & 2019 Five-Year ACS Data 2010 Census Units 1,610 906 89 170 868 16 975 4,634 2019 Five-Year ACS Units 1,014 720 36 147 954 7 1,784 4,662 Disposition % of Total 34.7% 19.6% 1.9% 3.7% 18.7% 0.3% 21.0% 100.0% % of Total 21.8% 15.4% 0.8% 3.2% 20.5% 0.2% 38.3% 100.0% For Rent For Sale Rented Not Occupied Sold Not Occupied For Seasonal, Recreational, or Occasional Use For Migrant Workers Other Vacant Total
HUDs Fair Housing Issues Segregation analysis Disparities in access to opportunity Disproportionate housing needs Publicly supported housing analysis Disability and access analysis Fair housing enforcement, outreach, etc.
Moderate to High Levels of segregation for African American and Hispanic households Segregation
Disparities in Access to Opportunity Access to Opportunity Indexes Low Poverty A measure of the degree of poverty in a neighborhood, at the Census Tract level. School Proficiency - school-level data on the performance of 4th grade students on state exams to describe which neighborhoods have high-performing elementary schools nearby and which are near lower performing schools. Jobs Proximity - quantifies the accessibility of a given residential neighborhood as a function of its distance to all job locations within a Core Based Statistical Area
Disparities in Access to Opportunity Access to Opportunity Indexes Labor Market Engagement - provides a summary description of the relative intensity of labor market engagement and human capital in a neighborhood Low Transportation Cost estimates of transportation costs for a family that meets the following description: a 3-person single-parent family with income at 50% of the median income for renters for the region Transit Trips - trips taken by a family that meets the following description: a 3-person single-parent family with income at 50% of the median income for renters Environmental Health - summarizes potential exposure to harmful toxins at a neighborhood level
Disparities in Access to Opportunity Disparities in Access to low poverty areas, proficient schools, and labor market engagement for Hispanic households
Housing Problems* Households are considered to have housing problems if they have one of more of the four problems: Cost Burdened defined as spending more than 30% of household income on housing 1. Housing unit lacks complete kitchen facilities; 2. Housing unit lacks complete plumbing facilities; 3. Household is overcrowded; and 4. Household is cost burdened. *As defined by HUD
Housing Problems Households with Incomplete Plumbing Facilities 2010 and 2019 Five-Year ACS Data Small Percentage of households lacking kitchen or plumbing facilities Households 2010 Five-Year ACS 2019 Five-Year ACS With Complete Plumbing Facilities Lacking Complete Plumbing Facilities Total Households Percent Lacking 64,447 67,871 271 159 64,718 0.4% 68,030 0.2% Households with Incomplete Kitchen Facilities Marion County Service Area 2010 and 2019 Five-Year ACS Data 2019 Five-Year ACS 67,246 784 68,030 1.2% Households 2010 Five-Year ACS With Complete Kitchen Facilities Lacking Complete Kitchen Facilities Total Households Percent Lacking 63,922 796 64,718 1.2%
Housing Problems Small Percentage of households experiencing overcrowding Overcrowding and Severe Overcrowding Marion County Service Area 2010 & 2019 Five-Year ACS Data Overcrowding % of Total Owner 97.3% 914 No Overcrowding Severe Overcrowding Data Source Total Households Households % of Total Households % of Total 2010 ACS 42,194 2.1% 255 0.6% 43,363 2019 ACS 43,574 97.1% 1,064 2.4% 252 0.6% 44,890 Renter 2010 ACS 19,192 89.9% 1,511 7.1% 652 3.1% 21,355 2019 ACS 21,314 92.1% 1,435 6.2% 391 1.7% 23,140 Total 2010 ACS 61,386 94.9% 2,425 3.7% 907 1.4% 64,718 2019 ACS 64,888 95.4% 2,499 3.7% 643 0.9% 68,030
Housing Problems Cost Burden and Severe Cost Burden by Tenure Marion County Service Area 2010 & 2019 Five-Year ACS Data 30.0% of households are cost burdened Less Than 30% 31%-50% Above 50% Not Computed Data Source Total % of Total % of Total % of Total % of Total Households Households Households Households Owner With a Mortgage 29.1% 19.3% Owner Without a Mortgage 10.0% 7.3% Renter 23.6% 22.1% Total 15,168 23.4% 11,909 17.5% 2010 ACS 2019 ACS 17,333 20,859 57.0% 71.0% 8,835 5,667 4,175 2,817 13.7% 9.6% 54 36 0.2% 0.1% 30,397 29,379 43.8% of renters are cost-burdened 2010 ACS 2019 ACS 10,823 13,571 83.5% 87.5% 1,291 1,127 741 682 5.7% 4.4% 111 131 0.9% 0.8% 12,966 15,511 2010 ACS 2019 ACS 10,546 11,677 49.4% 50.5% 5,042 5,115 4,551 5,011 21.3% 21.7% 1,216 1,337 5.7% 5.8% 21,355 23,140 2010 ACS 2019 ACS 38,702 46,107 59.8% 67.8% 9,467 8,510 14.6% 12.5% 1,381 1,504 2.1% 2.2% 64,718 68,030
Fair Housing Complaints Fair Housing Complaints with Cause by Basis Marion County Service Area HUD Fair Housing Complaints 2010 2011 2012 2013 0 0 1 0 0 0 0 0 0 0 0 0 0 0 0 0 0 0 0 0 0 Basis Disability Sex Race Color Retaliation National Origin Religion 2008 0 0 0 0 0 0 0 2009 0 0 0 0 0 0 0 2014 0 0 0 0 0 0 0 2015 0 0 0 0 0 0 0 2016 0 0 0 0 0 0 0 2017 0 1 0 0 0 0 0 2018 0 1 0 0 0 0 0 2019 0 0 1 0 0 0 0 Total 1 2 1 0 0 0 0 0 0 0 0 0 0 0 Total Basis 0 0 0 1 0 0 0 0 1 1 1 4 Total Complaints 0 0 0 0 1 0 0 0 1 1 1 1 5
Fair Housing Complaints Table I.6 Fair Housing Complaints with Cause by Issue Marion County Service Area HUD Fair Housing Complaints 2008 2009 2010 2011 2012 2013 2014 2015 2016 2017 2018 2019 Total 0 0 0 0 1 0 0 Discriminatory terms, conditions, privileges, or services and facilities Failure to make reasonable accommodation Discriminatory acts under Section 818 (coercion, Etc.) Discrimination in terms/conditions/privileges relating to rental Otherwise deny or make housing unavailable Discriminatory advertising, statements and notices Discriminatory refusal to rent and negotiate for rental None 0 0 0 0 Steering 0 0 0 0 Total Issues 0 0 0 Total Complaints 0 0 0 0 Issue Discriminatory refusal to rent 0 0 1 0 1 3 0 0 0 0 0 0 0 0 0 0 1 1 2 0 0 0 0 1 0 0 0 1 0 0 0 2 0 0 0 0 0 0 0 0 0 1 0 0 1 0 0 0 0 0 0 0 0 1 0 0 0 1 0 0 0 0 0 0 0 0 0 1 0 0 1 0 0 0 0 0 0 0 0 0 0 0 0 0 0 0 0 0 0 0 0 0 0 0 0 0 0 0 0 2 1 0 0 0 0 0 0 0 0 0 0 0 0 0 0 2 1 0 0 3 1 0 0 1 1 0 0 2 1 0 0 10 5
Fair Housing Survey 216 Responses to date Federal, State, and Local Fair Housing Laws Marion County 2021 Fair Housing Survey Data https://www.survey monkey.com/r/FHS_ MarionCounty Don't Know Question Yes No Missing Total Do you think fair housing laws are difficult to understand or follow? Do you know where to guide someone to file a complaint if they felt their fair housing rights had been violated? Outreach and education activities, such as training and seminars, are used to help people better understand their rights and obligations under fair housing law. Are you aware of the educational activities or training opportunities available to you to learn about fair housing laws? If you answered "yes" to the previous question, have you participated in fair housing activities or training? 68 79 62 7 216 69 140 0 7 216 34 166 0 16 216 23 49 0 144 216
FH Survey Barriers to Fair Housing in the Private Sector Marion County 2021 Fair Housing Survey Data Don t Know Question Yes No Missing Total Are you aware of any impediments to fair housing choice in Marion County in the following areas? The rental housing market (Example: Refusing to rent based on religion or color.) The home appraisal industry (Example: Basing home values on the ethnic composition of neighborhoods.) Housing construction and design fields (Example: New rental complexes built with narrow doorways that do not allow wheelchair accessibility.) The real estate industry (Example: : Only showing properties in certain areas to families with children.) The mortgage and home lending industry (Example: Offering higher interest rates only to women or racial minorities.) Any other housing services The home insurance industry (Example: Limiting policies and coverage for racial minorities.) 48 82 55 31 216 33 72 78 33 216 30 75 77 34 216 27 80 74 35 216 24 80 79 33 216 19 65 76 56 216 12 80 90 34 216
FH Survey Barriers to Fair Housing in the Public Sector Marion County 2021 Fair Housing Survey Data Don t Know Question Yes No Missing Total Are you aware of any impediments to fair housing choice in Marion County in the following areas? Barriers that limit access to government services, such as a lack of transportation, employment, or social services Land use policies (Example: Policies that concentrate multi- family housing in limited areas.) The public rental housing market (Example: Refusing to rent based on religion or color.) Occupancy standards or health and safety codes (Example: Codes being inadequately enforced in immigrant communities compared to other areas.) Any local government actions or regulations in your community that act as barriers to fair housing choice Zoning laws (Example: Laws that restrict placement of group homes.) Neighborhood or community development policies (Example: Policies that encourage development in narrowly defined areas of the community.) Publicly constructed housing (Example: New rental complexes built with narrow doorways that do not allow wheelchair accessibility.) 41 64 39 72 216 36 57 51 72 216 27 62 56 71 216 26 64 54 72 216 25 67 49 75 216 24 64 55 73 216 20 69 56 71 216 19 66 57 74 216
What else we are doing Evaluating mortgage denial rates for racial, ethnic, and gender disparities Looking at publicly supported housing and accessibility Continuing to collect public input
Community Input What barriers do households have in accessing housing What groups of people have issues accessing housing? What can the County do to help eliminate barriers to accessing housing?
Community Input - Housing What barriers do you see for developing affordable housing? Any County policies (i.e. zoning) that impacts the development of affordable housing? Any recommendations for the County on how to encourage affordable housing?
Community Input Other comments?
Next Steps Continuing to Collect Data and Public Input Draft for Public Review Final Plan Adoption of final plan and submission to HUD
Consolidated Plan Contact: Lisa Trauernicht Senior Policy Analyst LTrauernicht@co.marion.or.us