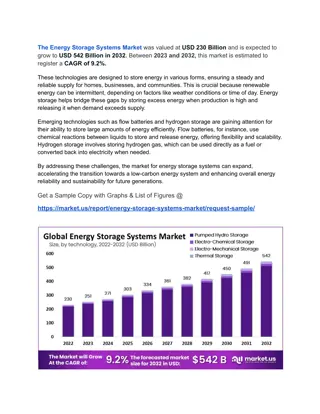
Market Impacts of Energy Storage in a Transmission-Constrained Power System
Explore the market impacts of energy storage in a transmission-constrained power system, considering technical, economic, and environmental aspects. The study examines the integration of renewable energy sources and the role of storage technologies in enhancing grid reliability and efficiency.

Download Presentation

Please find below an Image/Link to download the presentation.
The content on the website is provided AS IS for your information and personal use only. It may not be sold, licensed, or shared on other websites without obtaining consent from the author. If you encounter any issues during the download, it is possible that the publisher has removed the file from their server.
You are allowed to download the files provided on this website for personal or commercial use, subject to the condition that they are used lawfully. All files are the property of their respective owners.
The content on the website is provided AS IS for your information and personal use only. It may not be sold, licensed, or shared on other websites without obtaining consent from the author.
E N D
Presentation Transcript
Market Impacts of Energy Storage in a Transmission-Constrained Power System Vilma Virasjokia, Paula Rochaa,b, Afzal S. Siddiquib,c, and Ahti Saloa aDepartment of Mathematics and Systems Analysis, Aalto University, Finland bDepartment of Statistical Science, University College London, UK cDepartment of Computer and Systems Sciences, Stockholm University, Sweden EURO2015, 12-15 July, Glasgow Stochastic Models in Renewably Generated Electricity, Energy Storage and Renewables The document can be stored and made available to the public on the open internet pages of Aalto University. All other rights are reserved.
Agenda Introduction and Research Objectives Problem Formulation Numerical Example Discussion and Conclusions Vilma Virasjoki 14.7.2015 2/20
Introduction: Electricity Market Trends I. Deregulation Economic efficiency via competition But, evidence of market power II. Sustainability Regulation & economic incentives But, uncertainty & intermittency Strain on the Power System Ramping of conventional plants Possibility of network congestion Electricity not directly economically storable Storage Technologies Facilitate of RE integration Combined with, e.g.: 1. Reinforcements of the grid 2. Better congestion management 3. Enhanced demand response Limited transmission infrastructure Vilma Virasjoki 14.7.2015 3/20
Literature Review Storage increases social welfare at the expense of producers (market failure), and reducesprice- differentials (Schill and Kemfert, 2011) Cournot producers typically underuse their storage (Bushnell, 2003) Strategic use of storage, Mixed complementarity problems (MCP) Greenhouse gas (GHG)emissions may increase in the presence of both wind power and storage (Sioshansi, 2011) Under some structures, storage can reduce social welfare (Sioshansi, 2014) Environmental and economic impacts, Perfect competition vs. market power Optimal energy storage size and location (Awad et al., 2014) The annualized capital costs of storage would exceed the social welfare gains, and storage modestly increases CO2emissons (Lueken and Apt, 2014) Perfectly competitive, transmission-constrained energy system models Vilma Virasjoki 14.7.2015 4/20
Research Objectives and Contribution Research objectives Investigate the technical, economic and environmental impacts of energy storage by taking stochastic RE generation into account Framework Complementarity modeling Market power vs. perfect competition Uncertainty in RE Test network, Western Europe Contribution The combination of handling market power and RE uncertainty in a transmission-constrained energy market model with storage Vilma Virasjoki 14.7.2015 5/20
Problem Formulation: Assumptions 1. 2. Power line network with constraints: DC load-flow linearization Uncertainty in RE generation: Stochastic, discrete scenario tree Idea based on the winter school material by Daniel Huppmann and Friedrich Kunz, 2011 Corresponding to the critical morning ramp, availability factors based on typical morning hours production (6-7/2011, Germany, EEX), each path equiprobable Priority grid access, zero marginal costs Vilma Virasjoki 14.7.2015 6/20
Problem Formulation: Decision-makers Market participants simultaneous optimization problems Producers: A. Objective: Maximize exp. profit from sales incl. congestion fees B. Decisions: Power plant and storage operations C. Constraints: Energy balance, generation capacity, ramping, storing Grid owner: A. Objective: Maximize exp. profit from congestion fees B. Decisions: Electricity transmission between nodes C. Constraints: Transmission capacity 1. Perfect competition Expected social welfare maximized 2. Cournot oligopoly Producers make assumptions on their competitors production quantities SW Vilma Virasjoki 14.7.2015 7/20
Complementarity Modeling Required to represent the market equilbrium of Several interacting players (companies, grid owner) Interacting markets in time (dynamics of storage and power plant ramping) Interacting markets in place (the physical power system) Primal (decisions) and dual (price) variables considered simultaneously Efficient algorithms Suitable for a variety of energy market structures Vilma Virasjoki 14.7.2015 8/20
Mixed Complementarity Problem (MCP) For each producer & for the grid owner Market-clearing condition (i.e. supply matches demand) Lagrangian function Complementarity conditions Vilma Virasjoki 14.7.2015 9/20
Numerical Example 15-node and 28-line test network representing Western Europe Based on Gabriel and Leuthold (2010) Data based on 2011 Storage capacity No assumption on technology type Zero marginal costs (> 90% pumped hydro storage) Cycle efficiency 75 % Maximum charge/discharge rate 16 % Minimum level 30 % Four test cases Implemented in GAMS, Solver PATH Case Competition Storage Case 1: PC (ns) PC - Case 2: PC (s) PC Yes Case 3: CO (ns) CO - Case 4: CO (s) CO Yes Vilma Virasjoki 14.7.2015 10/20
Results Prices Moving electricity from excess supply to scarcity with storage leads to a price-smoothing effect between off-peak and peak periods. 65 60 55 50 Price ( /MWh) 45 40 35 30 PC, No Storage CO, No Storage PC, Storage CO, Storage 25 20 t5 t6 t7 t8 Time Vilma Virasjoki 14.7.2015 11/20
Results Expected Generation & Storing Producers with storage shift production from peak hours to off-peak s storage charging. CO producers withhold their power production and storage use. 1) 2) 3) Vilma Virasjoki 14.7.2015 12/20
Results Ramping Costs Producers with storage rely less on ramping their conventional generation at peak demand, which brings savings on costs. 100 No Storage Storage 90 80 70 60 50 k 40 30 -74% 20 -80% 10 0 Perfect Competition (PC) Cournot Oligopoly (CO) Vilma Virasjoki 14.7.2015 13/20
Results Network Congestion Storage alleviates network congestion because it reduces the expected congestion rent collected by the grid owner. 180 No Storage Storage -6% 160 140 120 100 -12% k 80 60 40 20 0 Perfect Competition (PC) Cournot Oligopoly (CO) Vilma Virasjoki 14.7.2015 14/20
Results Expected Power Flows Storage decreases total expected power flows under PC, but increases them under CO due to strategic withholding of supply. Table 1: Expected hourly power flows (GW), their sum ( ) and mean ( ?). denotes difference between No Storage and Storage cases. PC PC CO CO Hour (No Storage) (Storage) (No Storage) (Storage) t5 15.3 13.8 -1.5 14.1 15.2 1.1 t6 14.4 13.4 -1.0 14.8 14.8 0.0 t7 14.6 14.1 -0.5 14.9 15.0 0.1 t8 14.1 58.4 14.7 56.0 0.6 -2.4 14.7 58.6 14.4 59.4 -0.3 0.8 14.6 14.0 -0.6 14.6 14.8 0.2 ? Vilma Virasjoki 14.7.2015 15/20
Case n2: The Impact of Market Power Expected transmission is reversed to flow from east to west under CO due to strategic withholding of sales, and strategic use of storage. Table 2: Expected sales, n2 vs. total (GWh) Dominating transmission directions: Unchanged from PC: Reversed from PC: Bottlenecks CO(s) in n2 from PC(s) CO(s) Total from PC(s) Hour 44,3 -18% 116,6 -14% t5 47,2 -21% 125,4 -15% t6 50,8 -18% 133,9 -13% t7 53,7 -19% 141,4 -14% t8 Table 3: Expected storage levels, n2 vs. total (GWh) CO(s) in n2 from PC(s) CO(s) Total from PC(s) Hour 12,6 0% 27,9 -8% t5 14,2 +8% 29,5 -6% t6 12,9 +3% 28,1 -6% t7 9 0% 21,6 0% t8 Vilma Virasjoki 14.7.2015 16/20
Results CO2 emissions Storage may increase CO2 emissions under PC due to efficiency losses and an increase in coal and CCGT based generation at off-peak storage charging. 52 No Storage Storage Benchmark 51 250 50 +1.2% +3.0% +2.2% 200 +0.0% 49 48 Gg CO2 Gg CO2 150 47 100 46 45 PC, No Storage CO, No Storage PC, Storage CO, Storage 50 44 0 43 Perfect Competition (PC) Cournot oligopoly (CO) t5 t6 t7 t8 Time Vilma Virasjoki 14.7.2015 17/20
Conclusions In addition to corroborating some previous findings on storage impacts, e.g. price-smoothingeffect, storage may... 1. Reduce ramping and ramping costs 2. Alleviate network congestion 3. Increase (and reverse) expected power flows under market power due to a) strategic withholding of supply and b) strategic storage use 4. Increase CO2 emissions under PC Vilma Virasjoki 14.7.2015 18/20
Discussion Model limitations Relatively short studied time frame Stylized and aggregated form of the network Future research Market design Provide incentives to invest into storage capacity Essentially, ways to avoid market failure (i.e. society benefits but producers do not invest) and making use of the technical benefits Increase in GHG emissions Including emissions regulation Vilma Virasjoki 14.7.2015 19/20
Selected References Awad, A., Fuller, J., EL-Fouly, T., Salama, M.: Impact of Energy Storage Systems on Electricity Market Equilibrium. IEEE Transactions on Sustainable Energy, 2014 Bushnell, J.: A Mixed Complementarity Model of Hydrothermal Electricity Competition in the Western United States. Operations Research, 2003 European Energy Exchange: EEX Transparency Platform. http://www.eex-transparency.com/ Gabriel, S. A., Conejo, A. J., Fuller, J. D., Hobbs, B. F. and Ruiz, C.: Complementarity Modeling in Energy Markets. Springer, 2013 Gabriel, S. A. and Leuthold, F. U.: Solving Discretely-Constrained MPEC Problems with Applications in Electric Power Markets. Energy Economics, 2010 Hobbs, B. F.: Linear Complementarity Models of Nash-Cournot Competition in Bilateral and POOLCO Power Markets. IEEE Transactions on Power Systems, 2001 Huppmann, D. and Kunz, F.: Introduction to Electricity Network Modelling - PhD Winterschool Managing Uncertainty in Energy Infrastructure Investments held in Oppdal, Norway, 2011 IEA (International Energy Agency): www.worldenergyoutlook.org Lueken, R. and Apt, J.: The Effects of Bulk Electricity Storage on the PJM Market. Energy Systems, 2014 Schill, W.-P. and Kemfert, C.: Modeling Strategic Electricity Storage: The Case of Pumped Hydro Storage in Germany. The Energy Journal, 2011 Sioshansi, R.: Emissions impacts of Wind and Energy Storage in a Market Environment. Environmental Science & Technology, 2011 Sioshansi, R.: When Energy Storage Reduces Social Welfare. Energy Economics, 2014 Vilma Virasjoki 14.7.2015 20/20
Backup Material: DM Problems Producers problem: (1) (10) Grid owner s problem: (11) (15) Market-clearing condition: Vilma Virasjoki 14.7.2015 21
Backup Material: KKT Conditions (CO) Vilma Virasjoki 14.7.2015 22
Backup Material: Data Load profile from t5 to t8: 0.84, 0.92, 1.01, 1.07 The annual average hourly loads (GW): 62, 55, 2, 8, 3, 8, and 3 for nodes n1 n7, respectively The weighted average price is 50.2 /MWh Estimates for installed storage are based on operational installations power in 2014. At node n1, E.ON, RWE, EnBW, Vattenfall, and a fringe of German producers own 5, 11, 1, 16, and 3 GWh, respectively. EDF owns 30 GWh at node n2, and Electrabel owns a combined 6 GWh at nodes n3 and n6. Vilma Virasjoki 14.7.2015 23
Backup Material: Data References Gabriel, S. A. and Leuthold, F. U.: Solving Discretely-Constrained MPEC Problems with Applications in Electric Power Markets. Energy Economics, 2010 ENTSO-E: European Network of Transmission System Operators for Electricity. https://www.entsoe.eu/ European Energy Exchange: EEX Transparency Platform. http://www.eex-transparency.com/ Egerer, J., Gerbaulet, C., Ihlenburg, R., Kunz, F., Reinhard, B., Von Hirschhausen, C., Weber, A., and Weibezahn, J.: Electricity Sector Data for Policy-Relevant Modeling. Deutsches Institut f r Wirtschaftsforschung, DIW Data Documentation 72, 2014 Werner, D.: Electricity Market Price Volatility: The Importance of Ramping Costs. Working paper, Department of Agricultural and Resource Economics, University of Maryland, College Park 2014 Kumar N., Besuner, P., Lefton, S., Agan, D., and Hilleman, D.: Power Plant Cycling Costs. Intertek APTECH for the National Renewable Energy Laboratory (NREL) and Western Electricity Coordinating Council (WECC), Tech. Report, 2012 IPCC: 2006 IPCC Guidelines for National Greenhouse Gas Inventories. Intergovernmental Panel on Climate Change, International Guidelines, 2006 Sandia National Laboratories: DOE Global Energy Storage Database. http://www.energystorageexchange.org/ Companies websites and annual reports Vilma Virasjoki 14.7.2015 24


")


")