Markets and Society Figures - Insights on Work, Government Spending, and Spheres
Delve into a series of figures depicting the dynamics of paid and unpaid work across genders, government spending as a percentage of GDP, the estimated size of economic spheres in the US, and the informal sector's influence on global economies. Gain valuable insights into societal structures and market trends based on data from reputable sources such as the OECD, IMF, and US Bureau of Economic Analysis.

Download Presentation

Please find below an Image/Link to download the presentation.
The content on the website is provided AS IS for your information and personal use only. It may not be sold, licensed, or shared on other websites without obtaining consent from the author.If you encounter any issues during the download, it is possible that the publisher has removed the file from their server.
You are allowed to download the files provided on this website for personal or commercial use, subject to the condition that they are used lawfully. All files are the property of their respective owners.
The content on the website is provided AS IS for your information and personal use only. It may not be sold, licensed, or shared on other websites without obtaining consent from the author.
E N D
Presentation Transcript
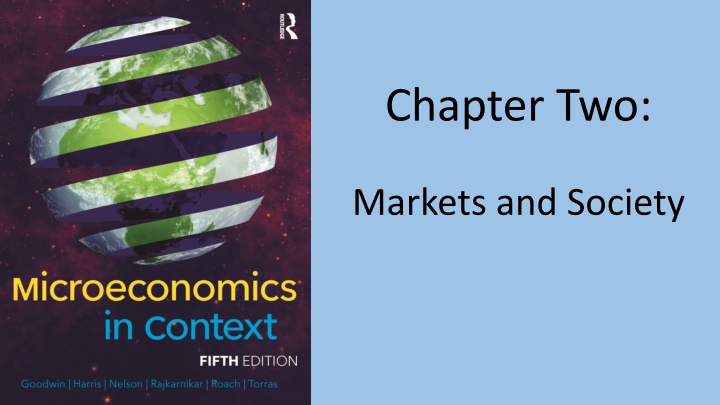
Chapter Two: Markets and Society
Figure 2.1 Paid and Unpaid Work, Male and Female, Selected Figure 2.1 Paid and Unpaid Work, Male and Female, Selected Countries Countries Source: OECD, OECD.Stat, Time Spent in Paid and Unpaid Work, by Sex .
Figure 2.2 Government Spending, Percentage of GDP, Selected Figure 2.2 Government Spending, Percentage of GDP, Selected Countries, 2019 Countries, 2019 Source: International Monetary Fund, World Economic Outlook database.
Figure 2.3 Estimated Size of the Three Spheres in the United Figure 2.3 Estimated Size of the Three Spheres in the United States, 2020 States, 2020 Sources: U.S. Bureau of Economic Analysis, National Income and Products Account database; Hess et al., 2020; and authors calculations.
Figure 2.4 The Average Size of the Informal Sphere, Percentage Figure 2.4 The Average Size of the Informal Sphere, Percentage of GDP, by World Region of GDP, by World Region Source: Medina and Schneider, 2019.